
Introduction
Oracle Business Intelligence Enterprise Edition (OBIEE) provides powerful capabilities for geospatial visualization. This comprehensive guide explores two implementation approaches: using predefined spatial datasets and implementing custom Malaysian map layers. We'll cover both paths to give you a complete understanding of the implementation options.
Part 1: Using Predefined Spatial Datasets
Initial Setup with Oracle's Sample Data
Before implementing custom Malaysian map layers, it's beneficial to understand the basic setup using Oracle's predefined spatial datasets. This approach provides a solid foundation for understanding OBIEE's mapping functionality.
1.1 Sample Dataset Acquisition
First, obtain the sample spatial dataset:
•
Download the HERE (Navteq) Sample for Oracle Analytics
•
Access the OA_HERE_MAPS.dmp file from Oracle's mapviewer zip repository
•
Navigate to Oracle's middleware downloads section for additional here-maps samples
This sample dataset includes comprehensive geographic information, including:
•
Continental boundaries
•
Country borders
•
State/province definitions
•
County/district delimitations
•
Urban area definitions
•
Street-level data for selected cities
1.2 Database Configuration
Execute these commands while connected to the OA_HERE_MAPS schema (password: Admin123):
-- Import map layer metadata
insert into user_sdo_maps select * from sdo_maps;
insert into user_sdo_themes select * from sdo_themes;
insert into user_sdo_styles select * from sdo_styles;
insert into user_sdo_cached_maps select * from sdo_cached_maps;
commit;
Bash
복사
1.3 MapViewer Configuration
Add the following datasource configuration to MapViewer:
<map_data_source name="OA_HERE_Sample"
jdbc_host="<host name>"
jdbc_sid="//pdborc12"
jdbc_port="1523"
jdbc_user="oa_here_maps"
jdbc_password="<password>"
jdbc_mode="thin"
number_of_mappers="10"
allow_jdbc_theme_based_foi="true"
editable="true"
/>
XML
복사
Add mds_config information in Mpaviewer configuration tab
<data_source name="OA_HERE_Sample">
<allow_predefined_themes>true</allow_predefined_themes>
<allow_dynamic_themes>true</allow_dynamic_themes>
</data_source>
XML
복사
Save and Restart Mapviewer server
1.4 BIEE Server Configuration
Update the OBIEE Presentation Server configuration (instanceconfig.xml) by adding:
<SpatialMaps>
<LayerDataLayout>
<MaxRecords>100000</MaxRecords>
</LayerDataLayout>
<MapViewerMaxTilesThreshold>50</MapViewerMaxTilesThreshold>
<MapViewerFOIClickableThreshold>100000</MapViewerFOIClickableThreshold>
</SpatialMaps>
XML
복사
Save and Restart Mapviewer server
Part 2: Malaysian Map Layer Implementation
2.1 Spatial Data Preparation
After understanding the basics with predefined datasets, let's implement Malaysian-specific map layers.
First, acquire the necessary spatial data:
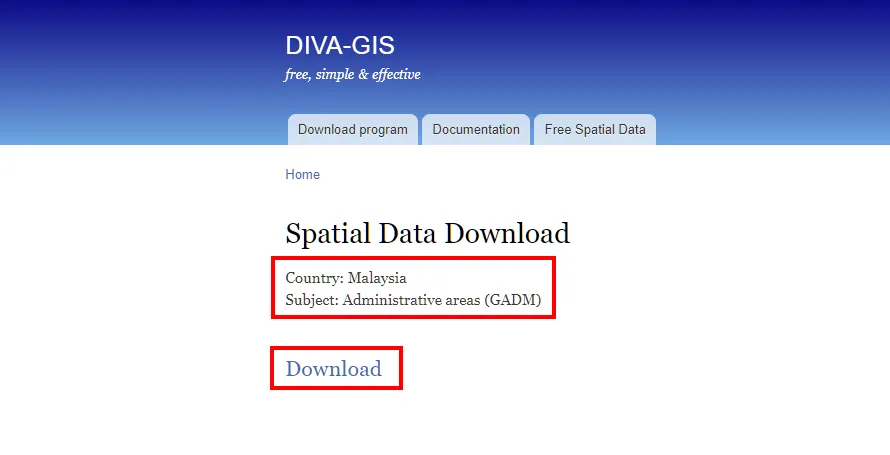
DIVA-GIS portal interface for downloading Malaysian administrative boundary data
The downloaded files include:
1.
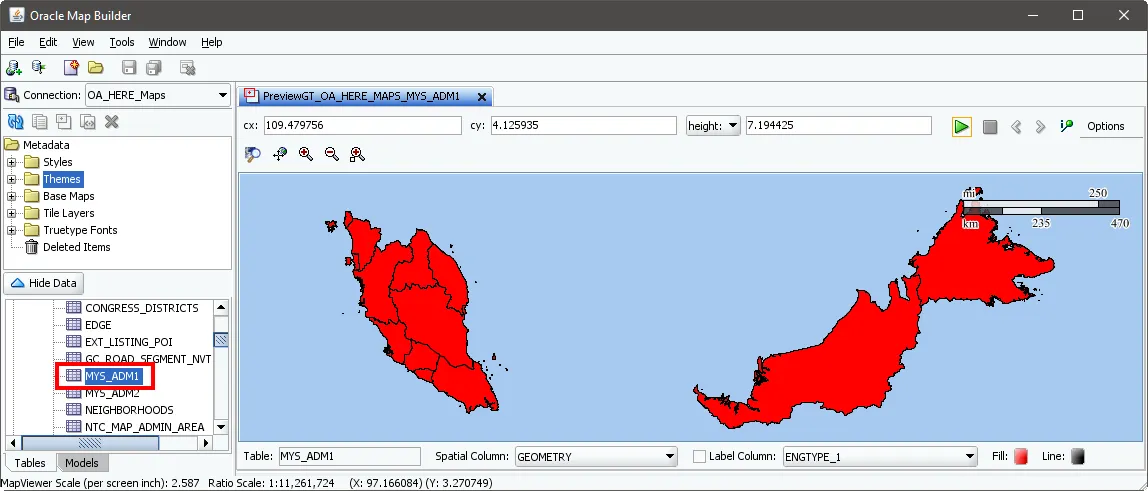
MYS_adm1.shp - State boundaries
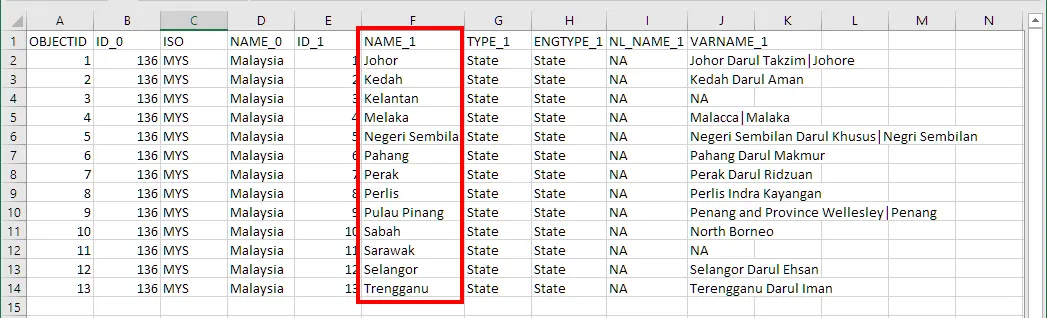
Figure 2: MYS_adm1 (State) Data
2.
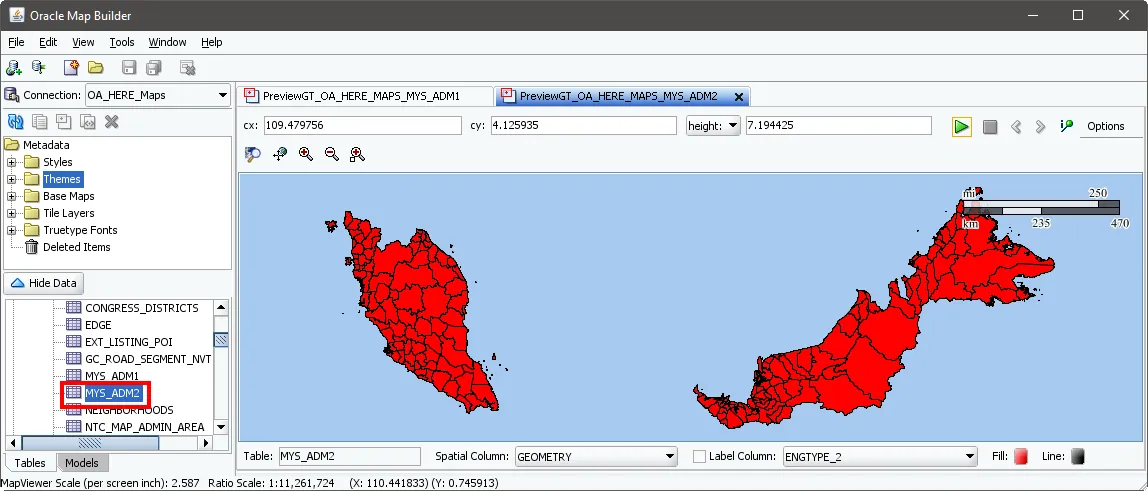
MYS_adm2.shp - District boundaries
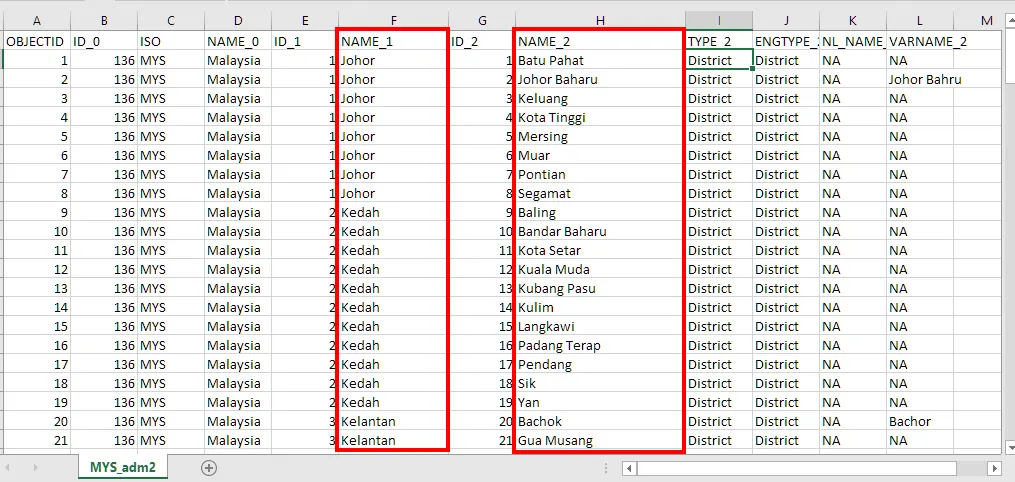
Figure 3: MYS_adm2 (District) Data
2.2 MapBuilder Setup and Configuration
Check your MapViewer version compatibility:
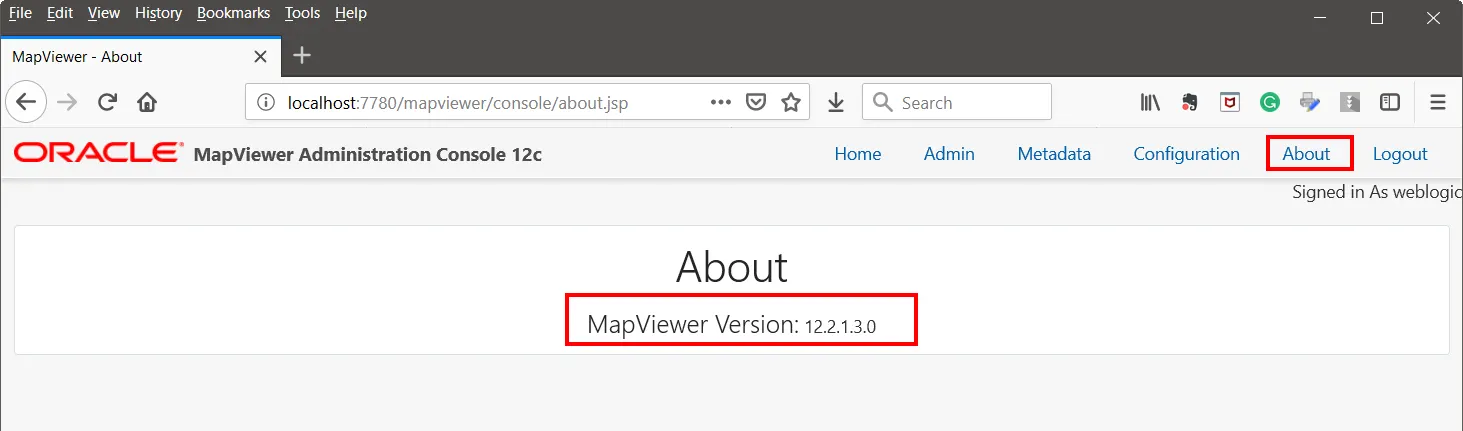
Verifying MapViewer version in the administration console
Before importing the Shapefile data into spatial tables in your Oracle database using Oracle MapBuilder, ensure you have the necessary prerequisites:
a.
Verify that the following JAR files are present on your database server:If sdoutl.jar and sdoapi.jar are missing, you can download them from the Oracle website:Oracle Spatial Downloads
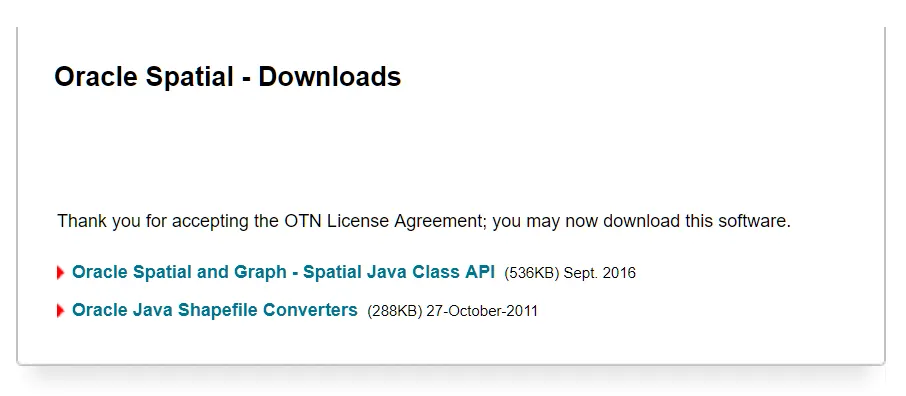
•
$ORACLE_HOME/jdbc/lib/ojdbc5.jar
•
$ORACLE_HOME/jlib/sdoutl.jar
•
$ORACLE_HOME/jlib/sdoapi.jar
b.
Copy the Shapefiles to the file system of your database server.
MapBuilder Download
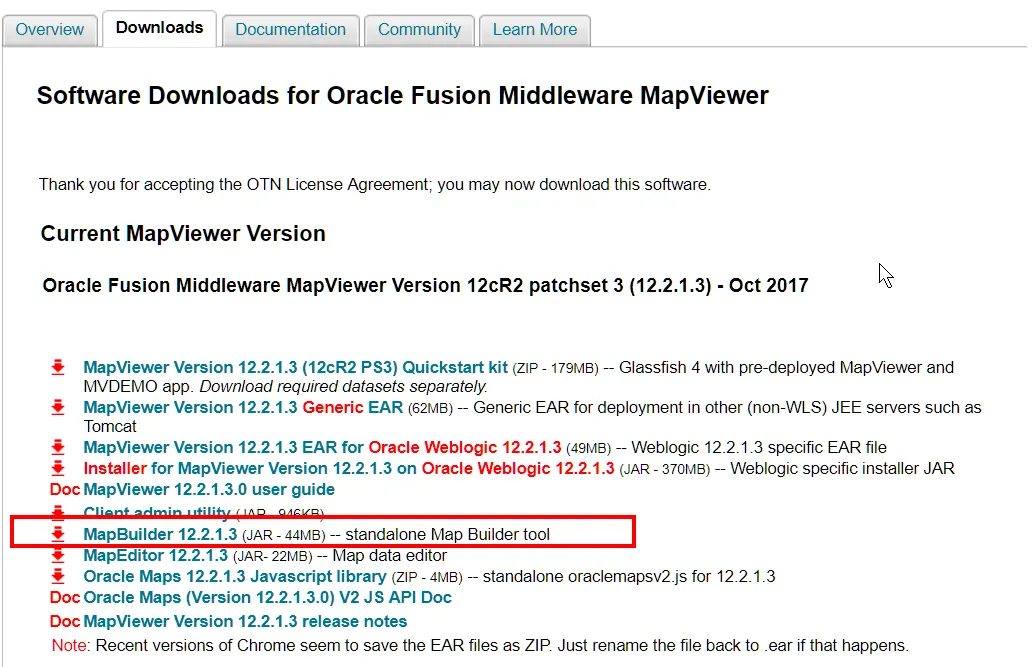
Figure 5: Oracle MapBuilder Download Page
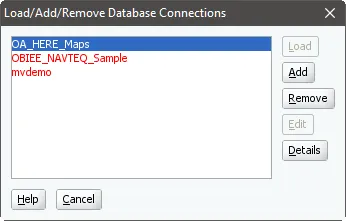
Start Oracle Mapbuilder and connect database by using connection as below:
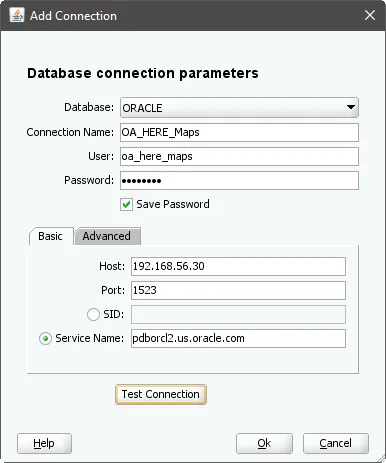
Database connection settings in MapBuilder
Use MapBuilder to import the Shapefile data into spatial tables in your Oracle database. This process will create the necessary spatial tables and themes for your Malaysian map layers.
2.3 Import Shapefile into Oracle Database
Now, proceed with the import process:
1.
Import Shapefile and create Theme
By following these steps, you'll successfully import the Shapefile data into your Oracle database, preparing it for use in OBIEE map visualizations.
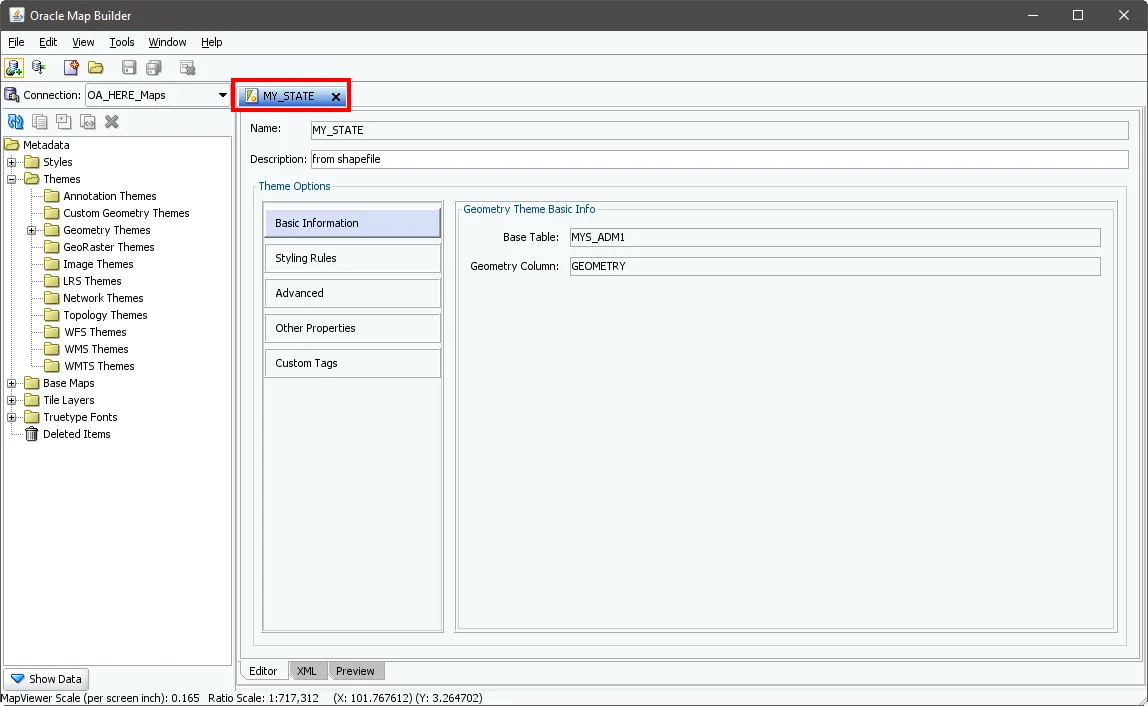
For MY_STATE Them:
a.
Start the import process for the MY_STATE shapefile.
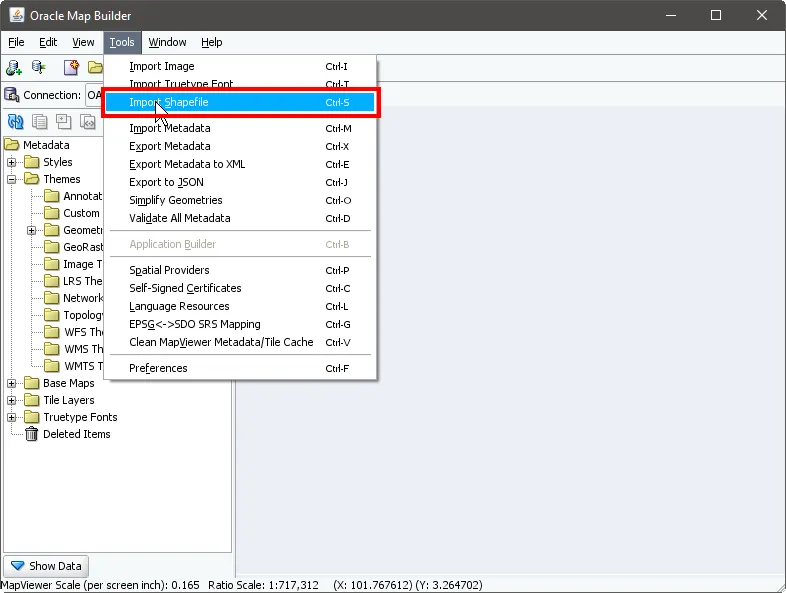
Start import shapefile
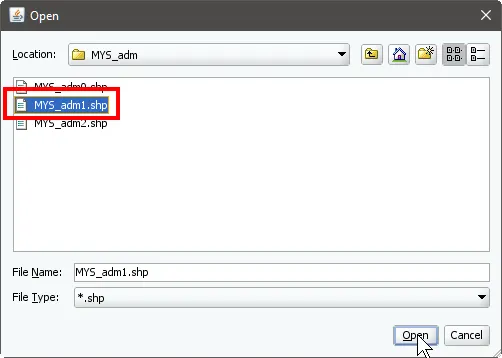
Open shape file(shp)
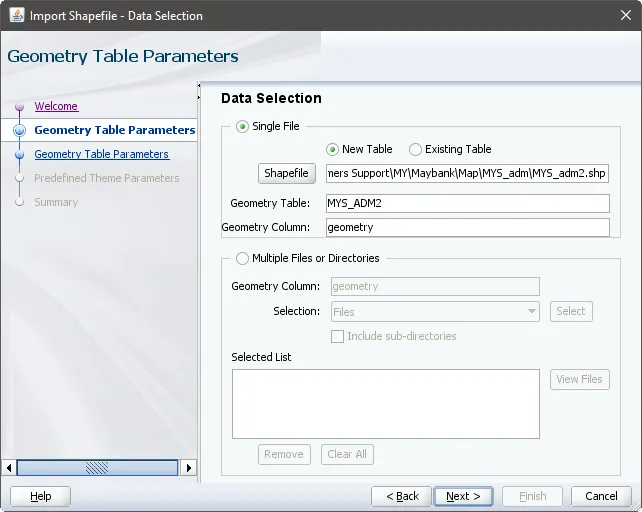
b.
Set Geometry Table Parameters
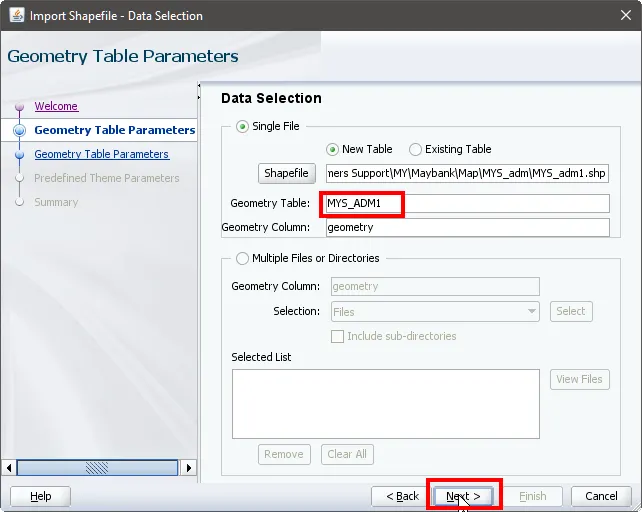
Import Shapefile - Data Selection
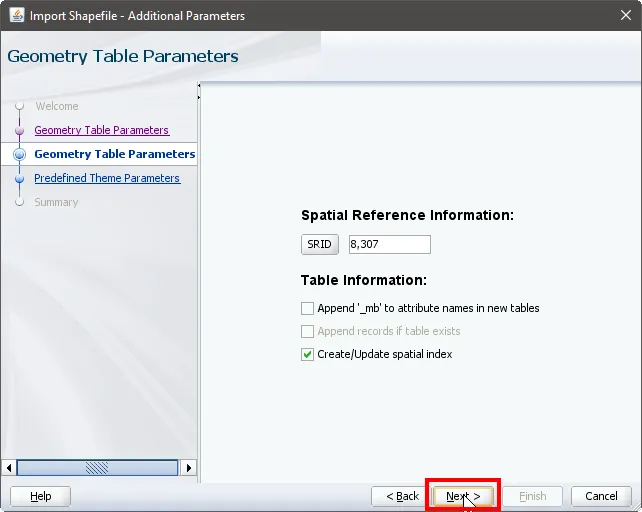
Choose MY_STATE Coordinate System
c.
Predefined Theme Parameters
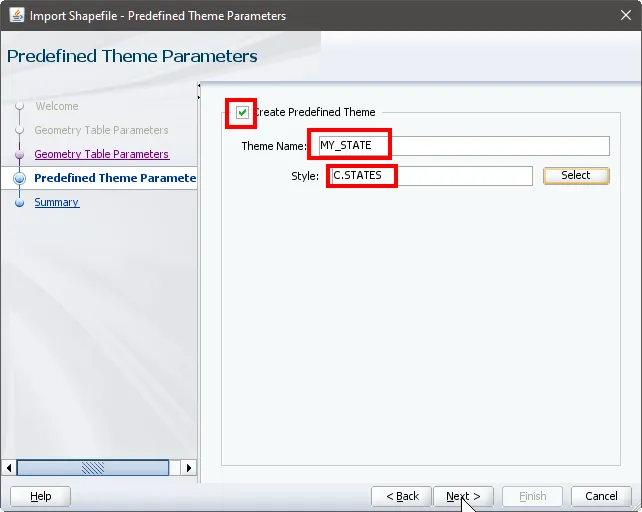
Select MY_STATE Columns to Import
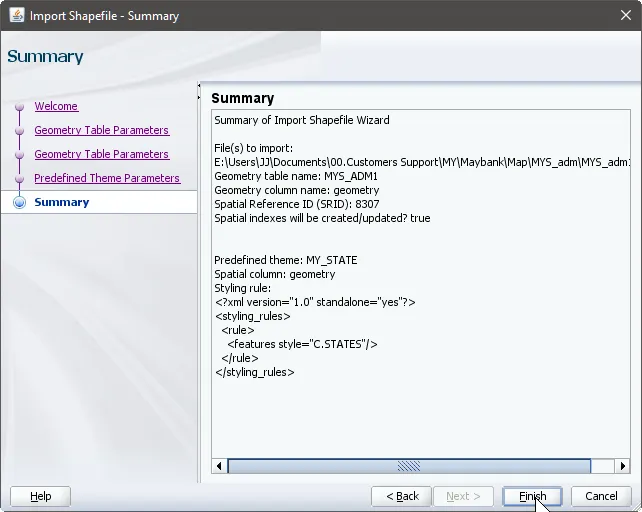
Figure 13: Import Shapefield Wizard Summary
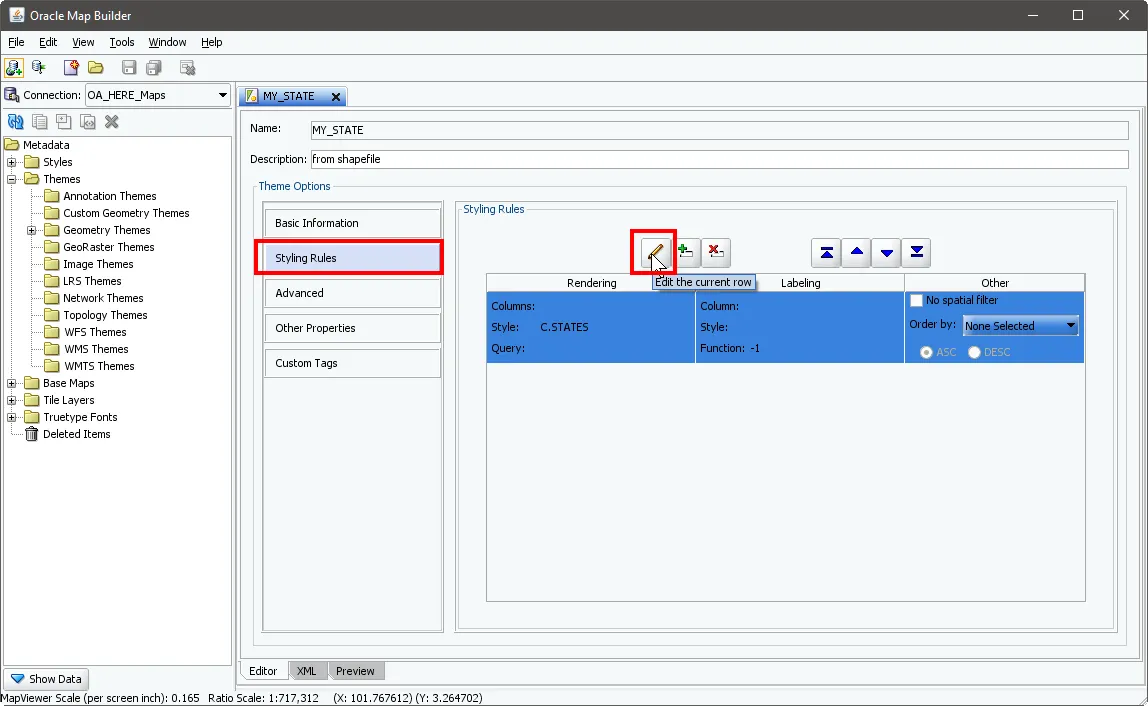
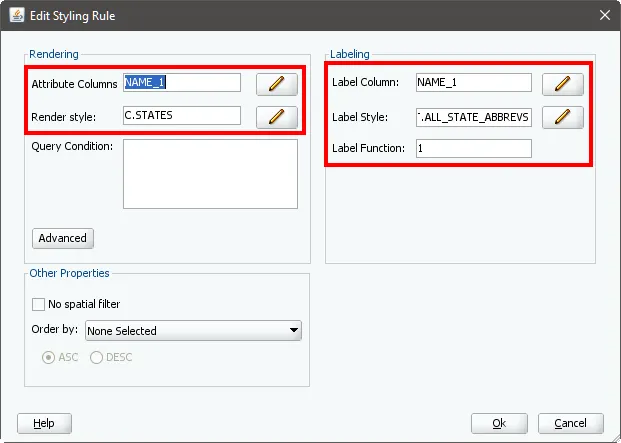
Set styling rules for the MY_STATE theme.
Choose the label column for MY_STATE.
For MY_DISTRICT:
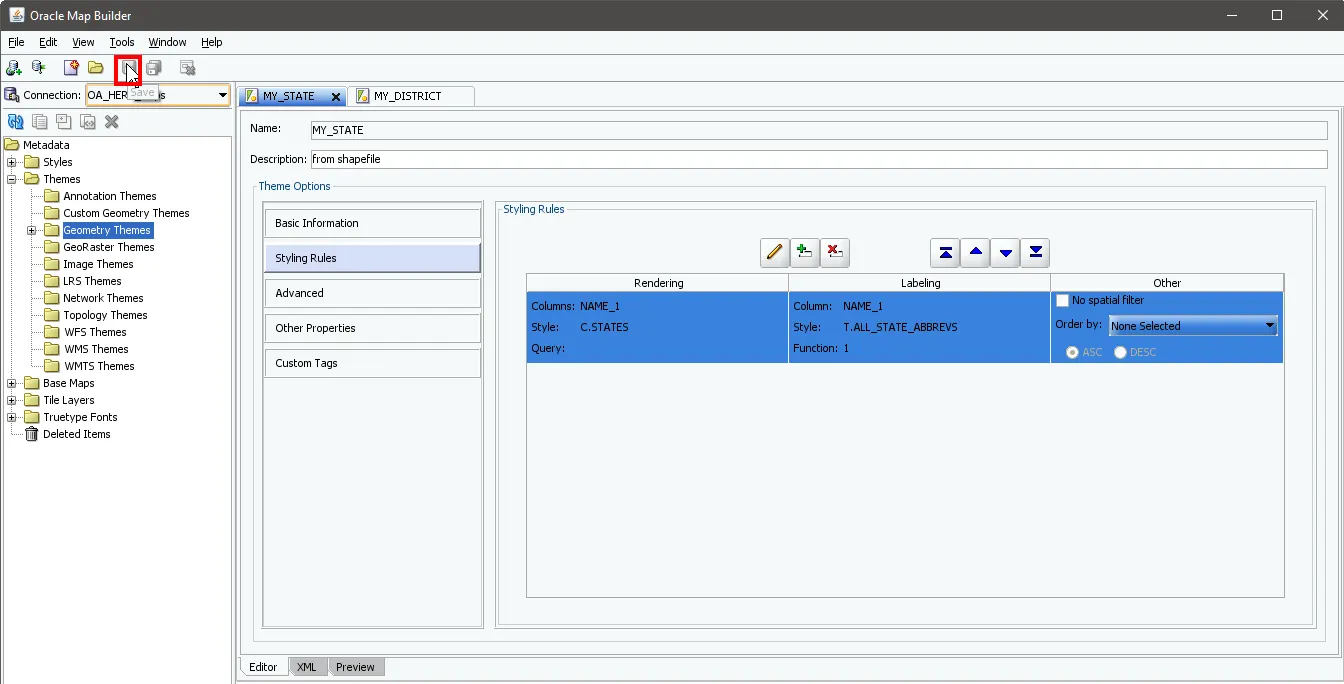
Follow the same procedure as the above.You can modify rendering and labeling styles by editing the Styling Rule of the Theme.To check the spatial tables populated from the above procedures:
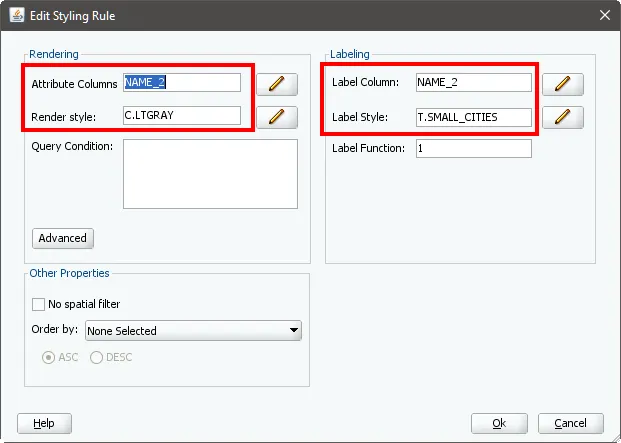
Setting up the MY_DISTRICT layer with detailed styling options
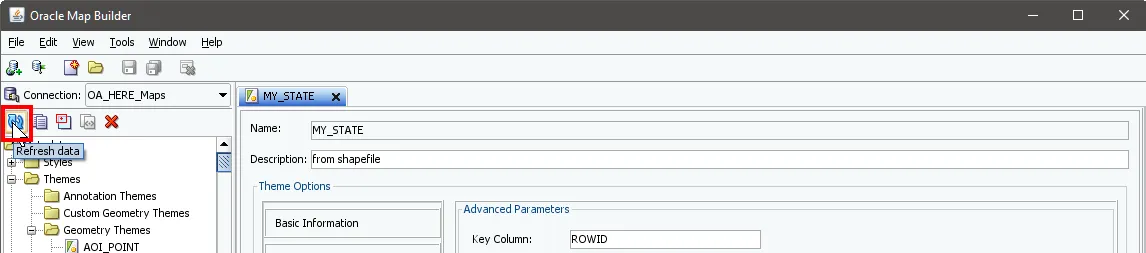
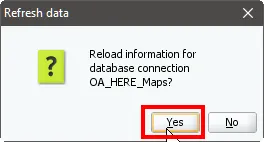
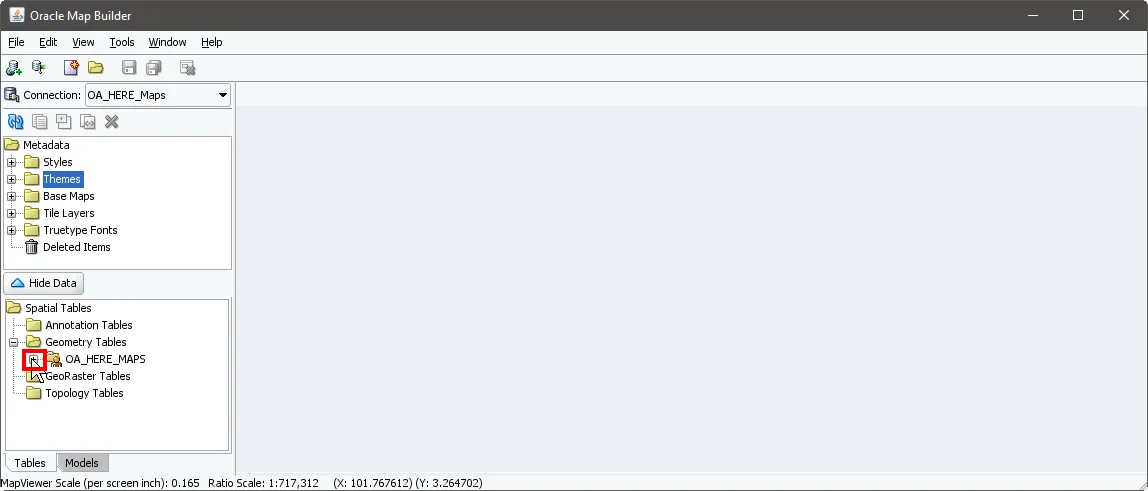
If you want to check the spatial tables populated from the above procedures:
MY_STATE Theme
MY_DISTRICT Theme
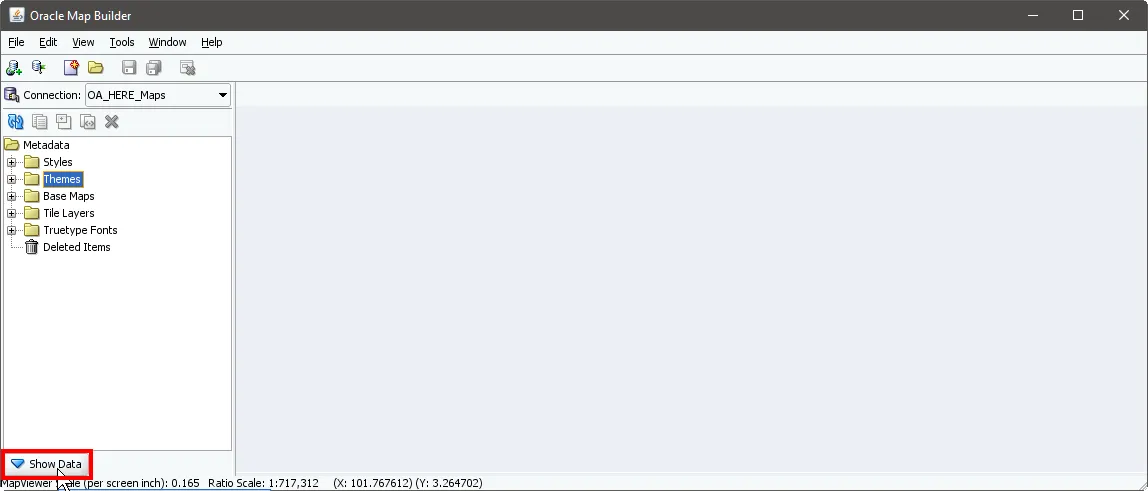
2.4 Generate Base Map and Tile Layers
Duplicate the existing "WORLD_MAP" base map and customize it for Malaysia.Base Map Creation. Creating a new base map in Oracle Map Builder by duplicating and customizing an existing one is a common and efficient approach when setting up map layers.
Starting with the WORLD_MAP as our template, here's the detailed process:
First, we need to duplicate the existing base map:
1.
In the Oracle Map Builder interface, navigate to the Base Maps section in the left panel.
2.
Right-click on "WORLD_MAP" from the list of existing base maps. This brings up a context menu with several options.
3.
Select "Duplicate" from the menu options. A dialog box titled "Duplicate Base Map" appears.
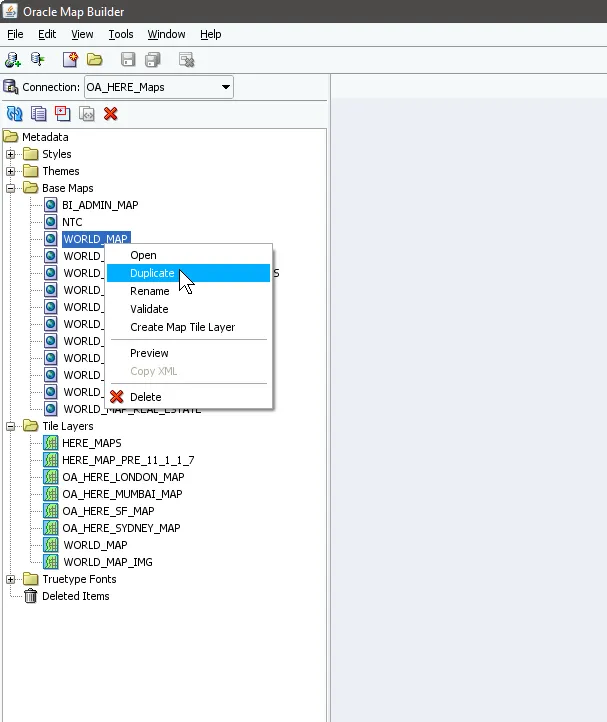
Oracle Map Builder interface showing the Base Maps section with WORLD_MAP selected and the context menu displaying the "Duplicate" option.
4.
In the dialog box, enter "MALAYSIAN_MAP" as the New Name. The Target Database field should already show "OA_HERE_Maps" which we'll keep.
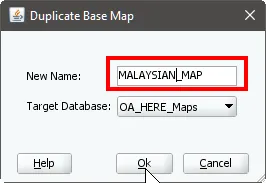
The "Duplicate Base Map" dialog box where "MALAYSIAN_MAP" is being entered as the new map name, with "OA_HERE_Maps" set as the target database.
Next, we'll set up the tile layer definition:
5.
Right-click on the newly created MALAYSIAN_MAP and select "Create Internal Tile Layer". This opens the "Define a Map Cache Instance" wizard.
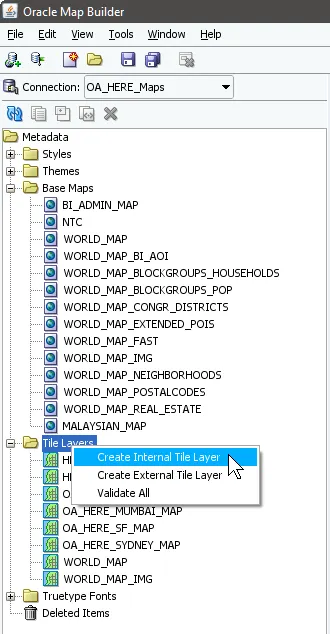
The expanded Base Maps tree showing the newly created MALAYSIAN_MAP, with the context menu displaying "Create Internal Tile Layer" option.
6.
In the Tile Layer Definition window:
•
Enter "MALAYSIAN_MAP" as the Name
•
Leave the Description field blank (optional)
•
Ensure "Use a Basemap" is selected
•
Confirm MALAYSIAN_MAP is selected in the Base Map dropdown
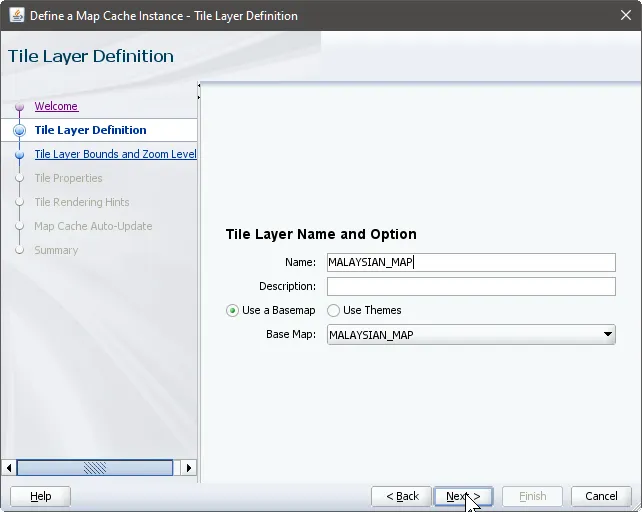
The "Define a Map Cache Instance - Tile Layer Definition" window where basic properties of the tile layer are being configured, including the name and base map selection.
7.
In the Tile Layer Bounds and Zoom Levels section:
•
Use the map preview to adjust the view to focus on the Malaysian region
•
Click "Update from Map" to set the boundary coordinates
•
Set appropriate zoom levels using "Scale From Map" and "Add Level" buttons
•
The system will calculate and display various scale levels (from level0 to level12)
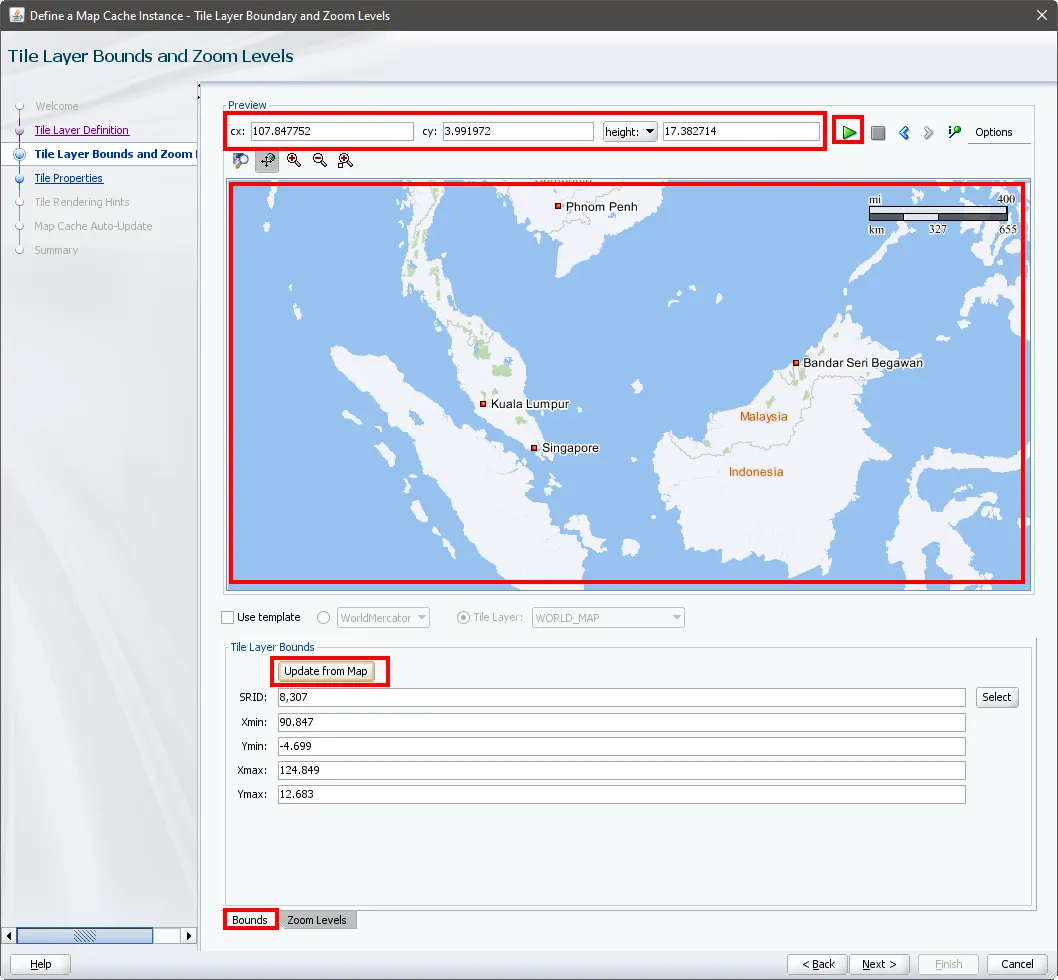
The "Tile Layer Boundary and Zoom Levels" configuration window showing the map preview centered on Malaysia, with coordinate values and the "Update from Map" button highlighted.
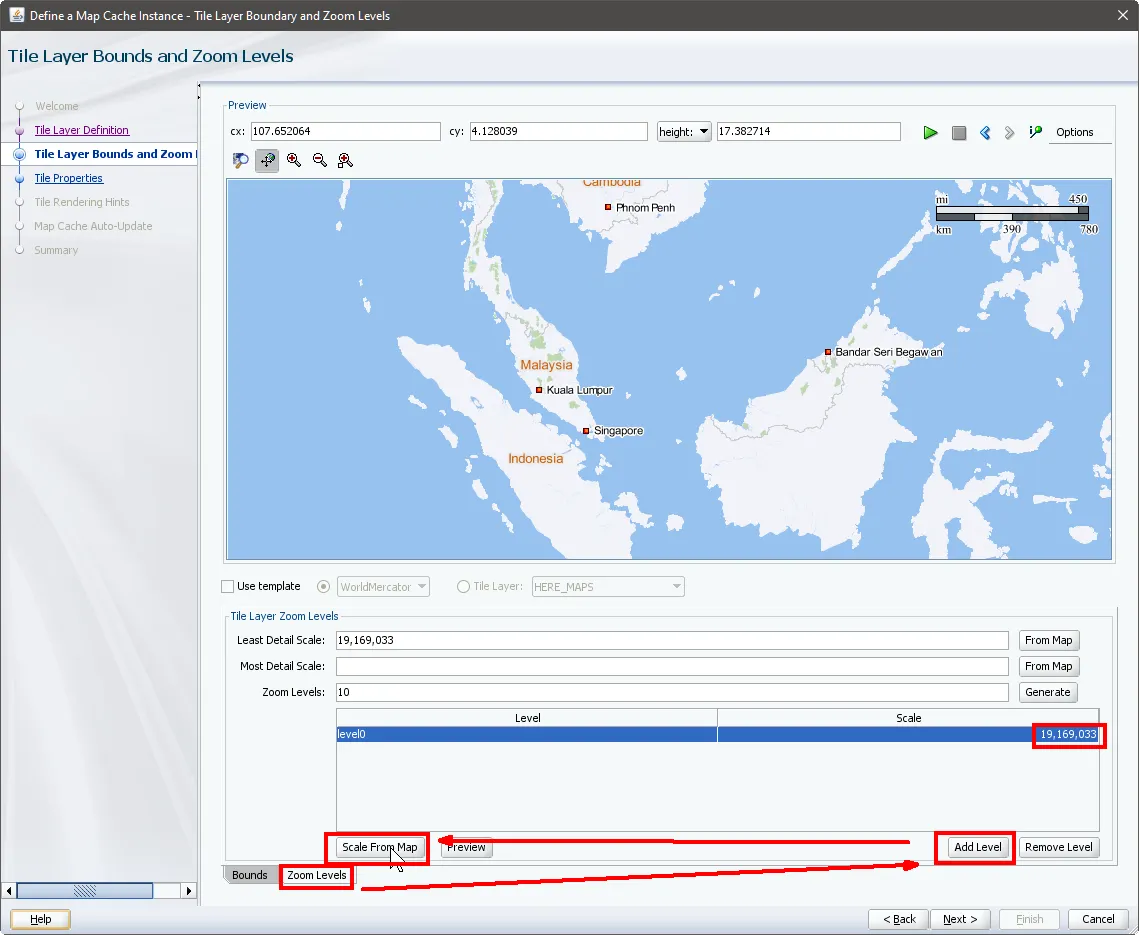
The zoom levels configuration panel displaying the scale settings, with options to add or remove zoom levels using the interface buttons at the bottom.
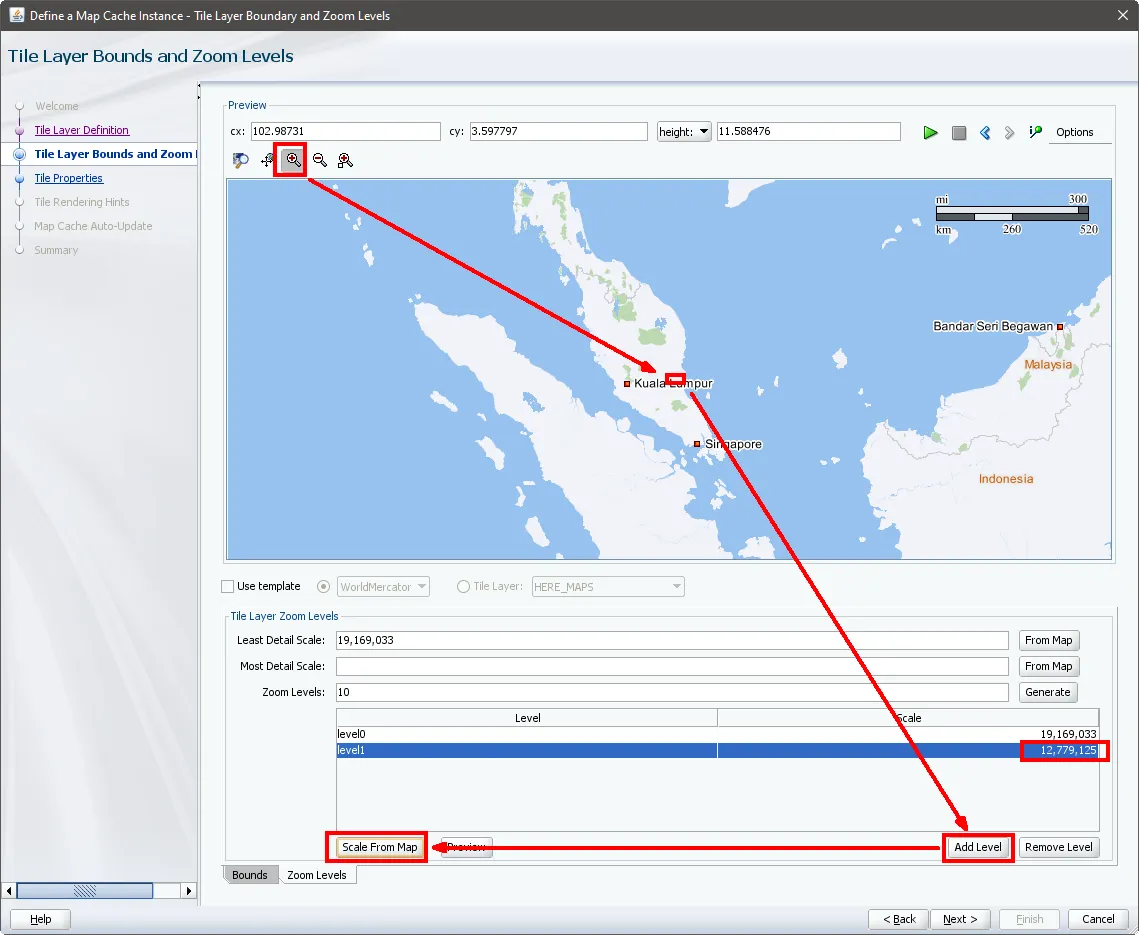
The interface demonstrating how to add a new zoom level using the magnifying glass tool and "Scale From Map" functionality.
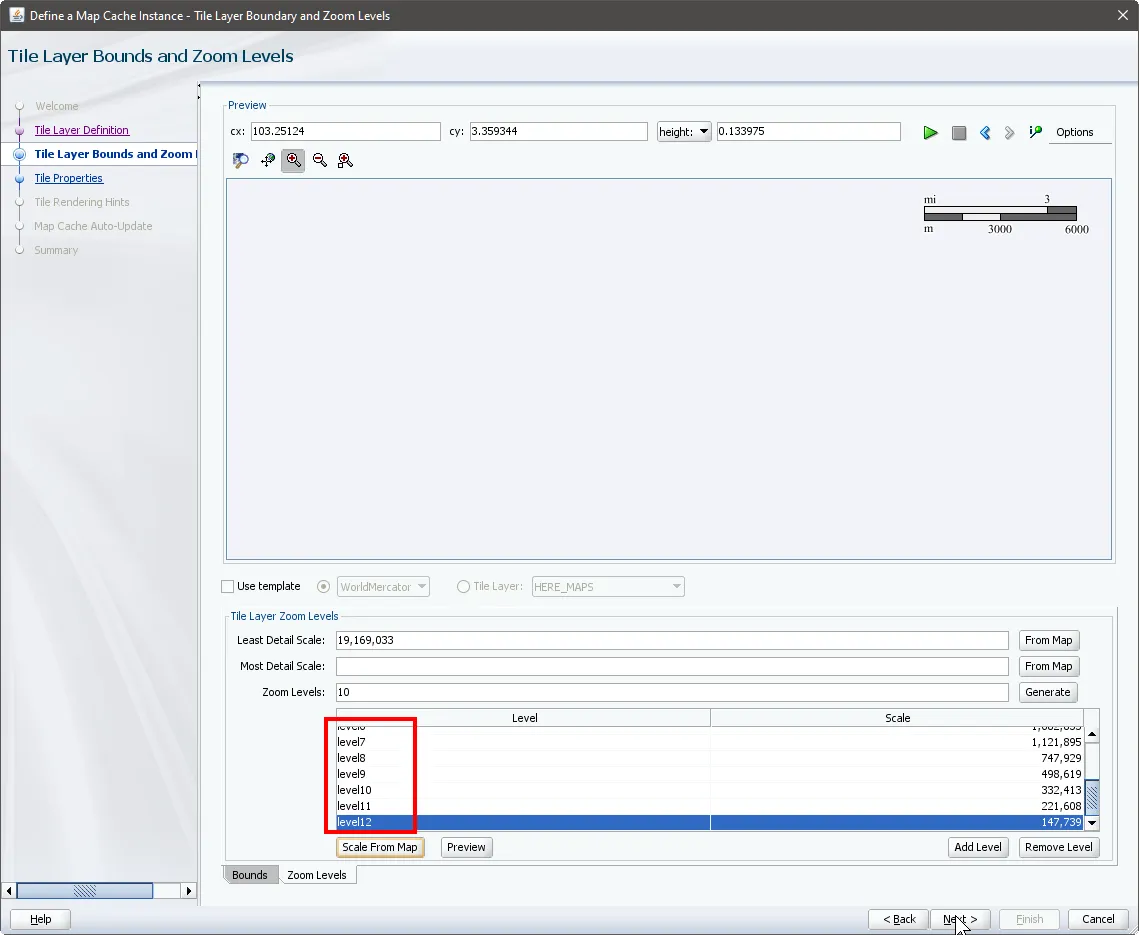
The complete zoom levels panel showing multiple scale levels from level0 to level12, representing different map detail resolutions.
8.
For Tile Properties:
•
Set Tile Width: 800
•
Set Tile Height: 600
•
Select PNG as the Tile Format
•
Set Tile Storage to "/temp"
•
Keep the default DPI setting at 96.0
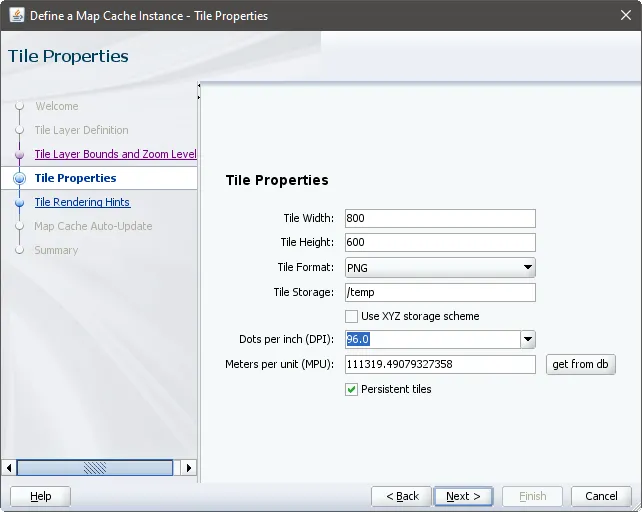
The "Tile Properties" configuration window where tile dimensions, format, and storage settings are being defined.
9.
In Tile Rendering Hints:
•
Enable Antialiasing for better image quality
•
Leave other settings at their defaults
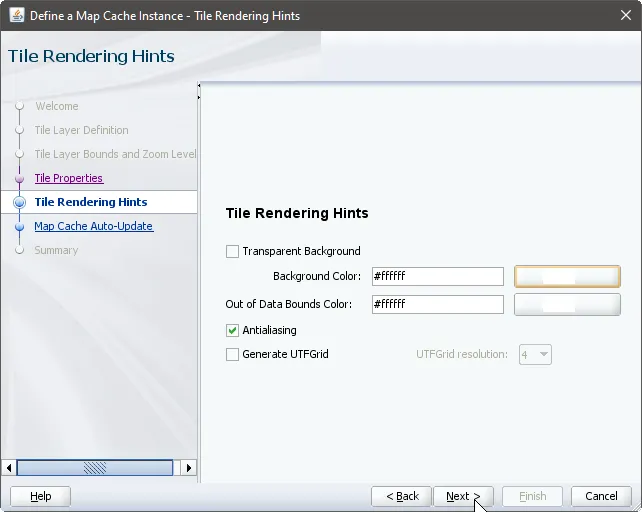
The "Tile Rendering Hints" window showing antialiasing and other visual enhancement options for the map tiles.
10.
For Map Cache Auto-Update:
•
Leave settings at their defaults
•
This section can be skipped for initial setup
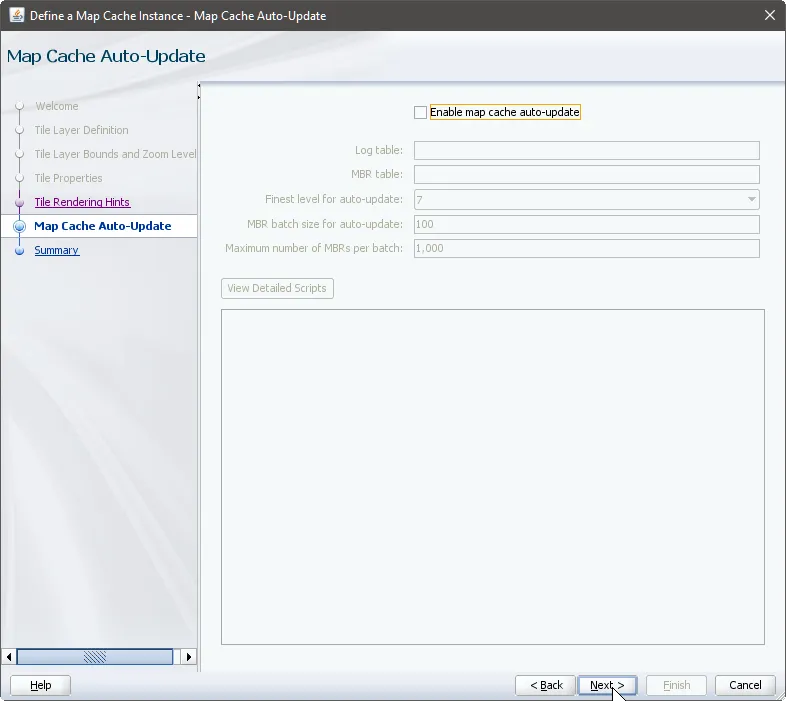
The "Map Cache Auto-Update" configuration panel with default settings for cache management and updating.
The final Summary page shows all your configurations in XML format, confirming the setup of your new Malaysian map base layer with appropriate zoom levels and tile properties.
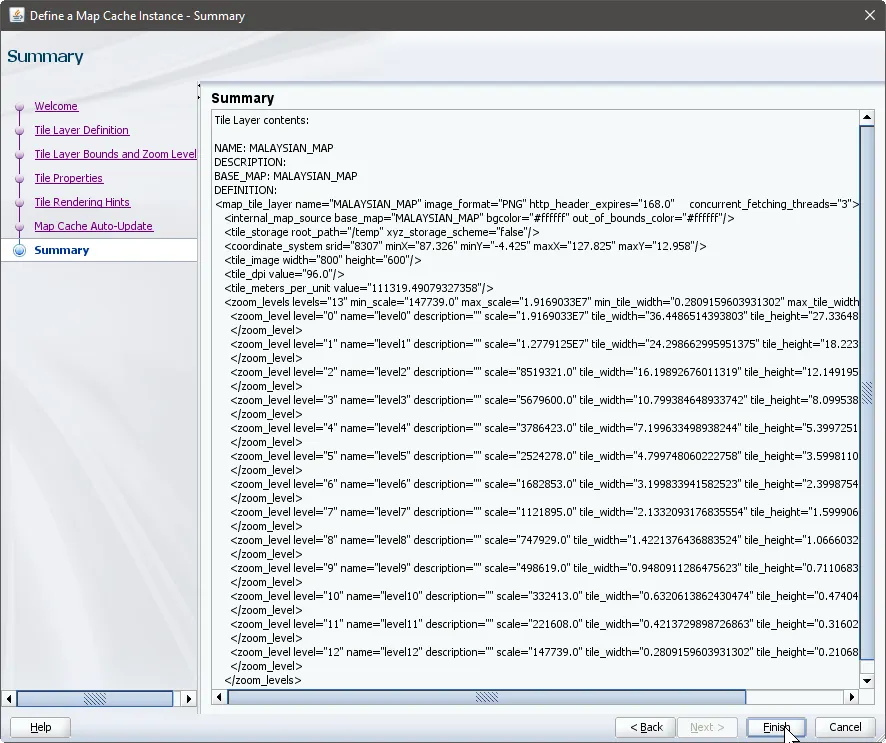
The "Summary" page displaying the complete XML configuration for the newly created Malaysian map tile layer.
This process creates a new base map specifically optimized for displaying the Malaysian region, while maintaining the professional cartographic standards of the original WORLD_MAP template. The duplicate-and-customize approach saves time while ensuring consistency with existing map standards.
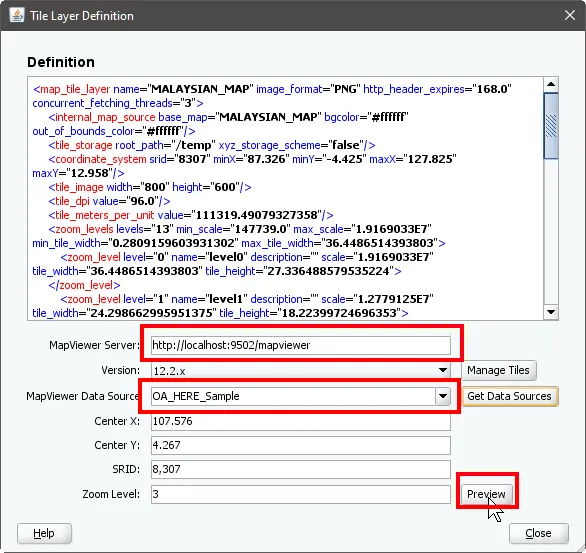
The final "Tile Layer Definition" window showing the MapViewer server configuration and preview options for the completed base map.
2.5 Importing Map Tile Layers and Associating with BIEE
This section will guide you through the process of managing map data layers in Oracle Business Intelligence Enterprise Edition (OBIEE), specifically focusing on importing map tile layers and associating them with BI key columns.
1.
Accessing Map Data Management
First, we need to access the Map Data Management interface through the Oracle BI Administration console. Looking at the image below, we can see the administration page where "Map Data Management" is listed under the main menu. This is where we'll manage all our geographic data components.
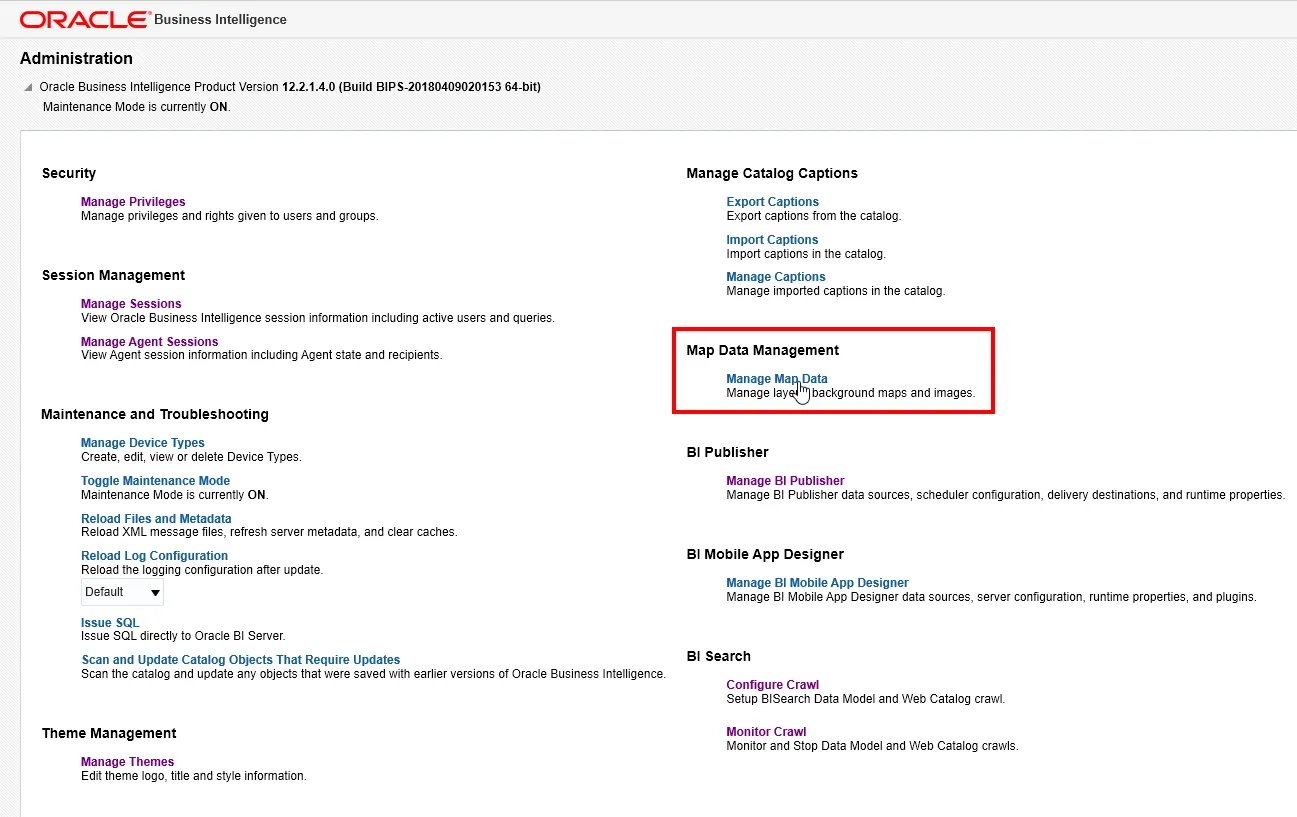
the Oracle BI Administration page where we can access the Map Data Management interface. The red box highlights the "Map Data Management" section, which allows us to manage layers, background maps, and map images.
When we click through to Map Data Management (shown in Figure 2), we're presented with a clean interface that has three main tabs: Layers, Background Maps, and Images. For our task, we'll be working primarily in the Layers tab.
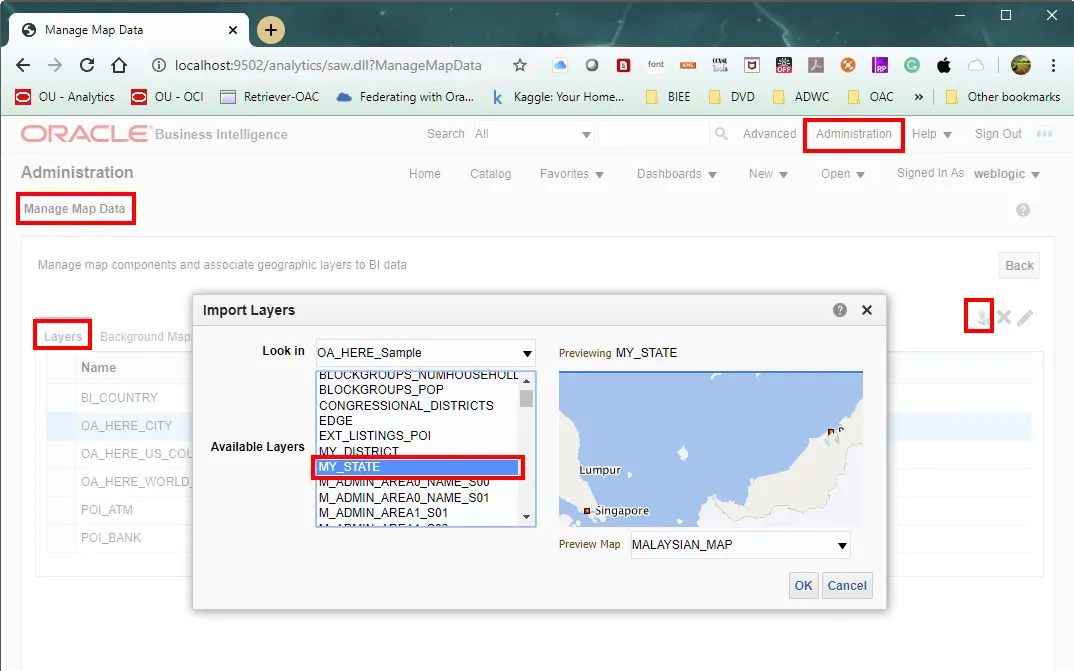
Image demonstrates navigating to the Map Data Management tool through the Administration interface. We can see the "Layers" tab selected and the import button highlighted for adding new map layers.
2.
Importing Map Tile Layers
Let's begin with importing our map layers. We'll be working with two specific layers: MY_STATE and MY_DISTRICT. Here's how we proceed:
For MY_STATE:
a.
In the Layers tab, click the import button (the plus icon in the top right)
b.
The Import Layers dialog opens, showing "OA_HERE_Sample" as our data source
c.
From the Available Layers list, we select "MY_STATE"
d.
We can see a preview of the Malaysian region in the right panel
e.
Click OK to import the layer

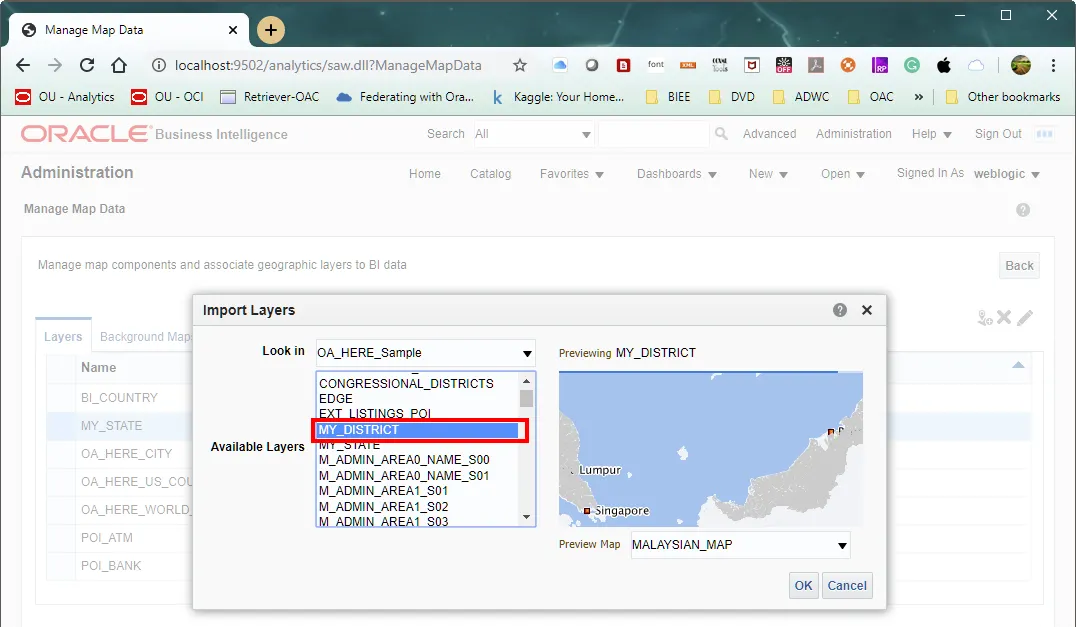
In this image, we're importing the MY_DISTRICT layer. We can see the selection of "MY_DISTRICT" from the OA_HERE_Sample data source in the Available Layers list, with a preview of the Malaysian map region shown on the right.
For MY_DISTRICT:
Following the same process (shown in the image below), we select "MY_DISTRICT" from the available layers. The preview window helps us confirm we're selecting the correct geographic level.
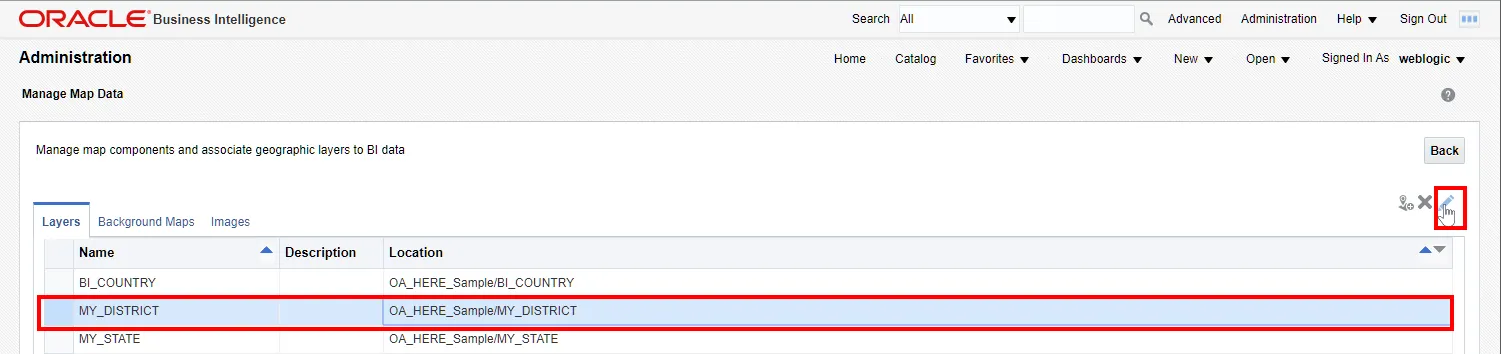
This shows the successful import of both MY_STATE and MY_DISTRICT layers, which are now listed in the Layers tab of the Map Data Management interface. Both layers are properly located under the OA_HERE_Sample namespace.
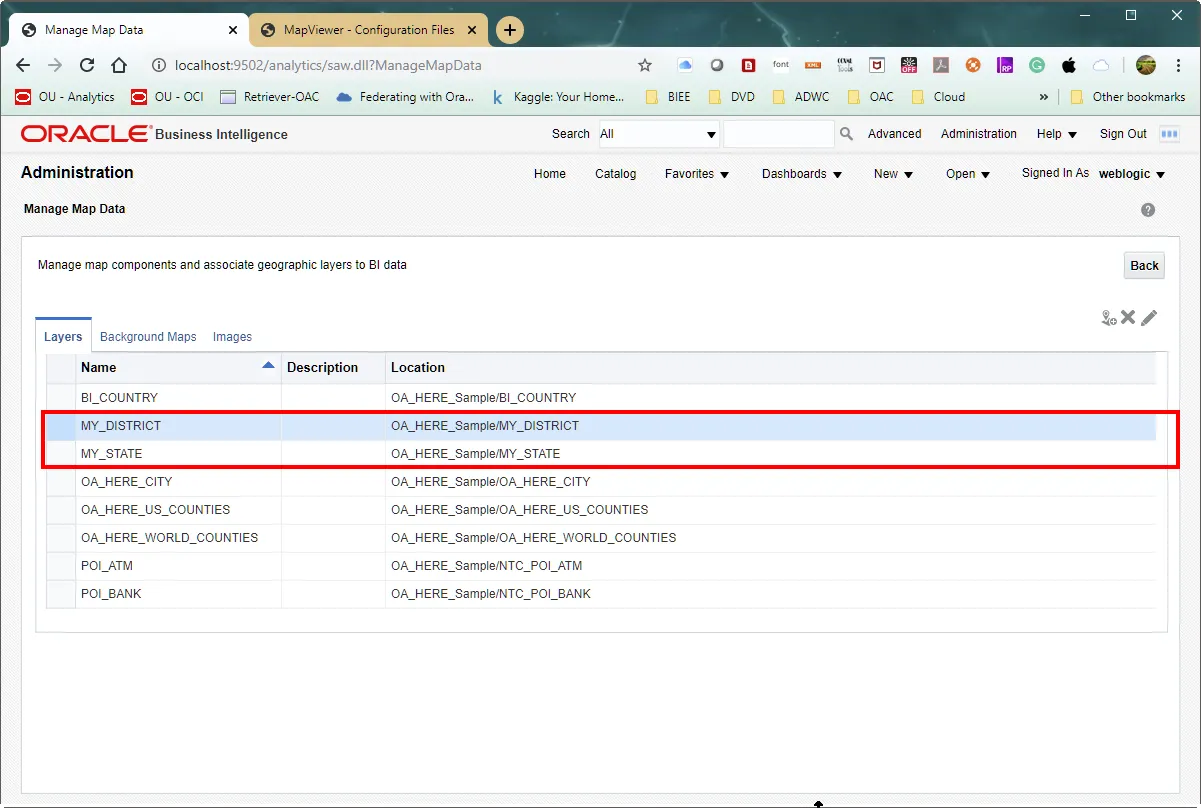
The above image shows our success - both MY_STATE and MY_DISTRICT are now listed in the Layers tab, each properly registered under the OA_HERE_Sample location.
3.
Associating Layers with BI Key Columns
Now comes the crucial part - connecting our geographic layers to our business data. Let's set up each layer:
For MY_STATE:
a.
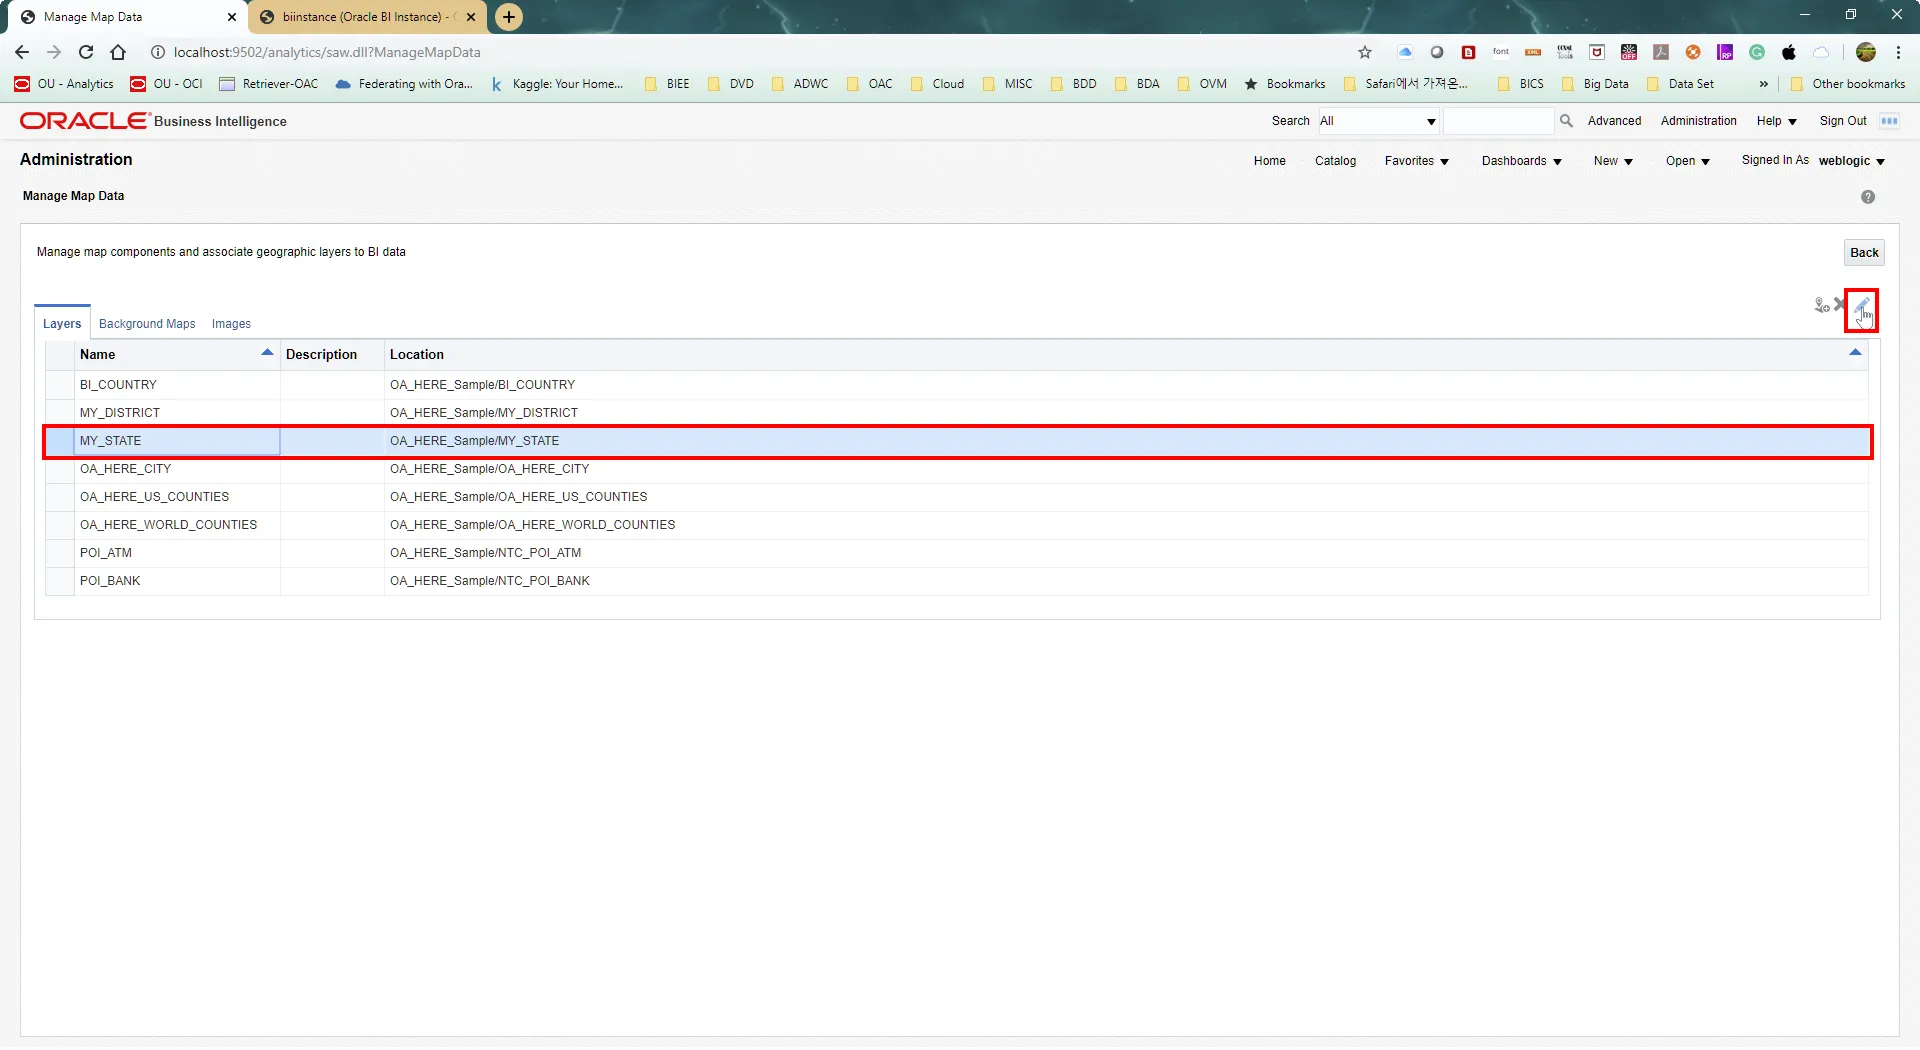
Select MY_STATE in the Layers list
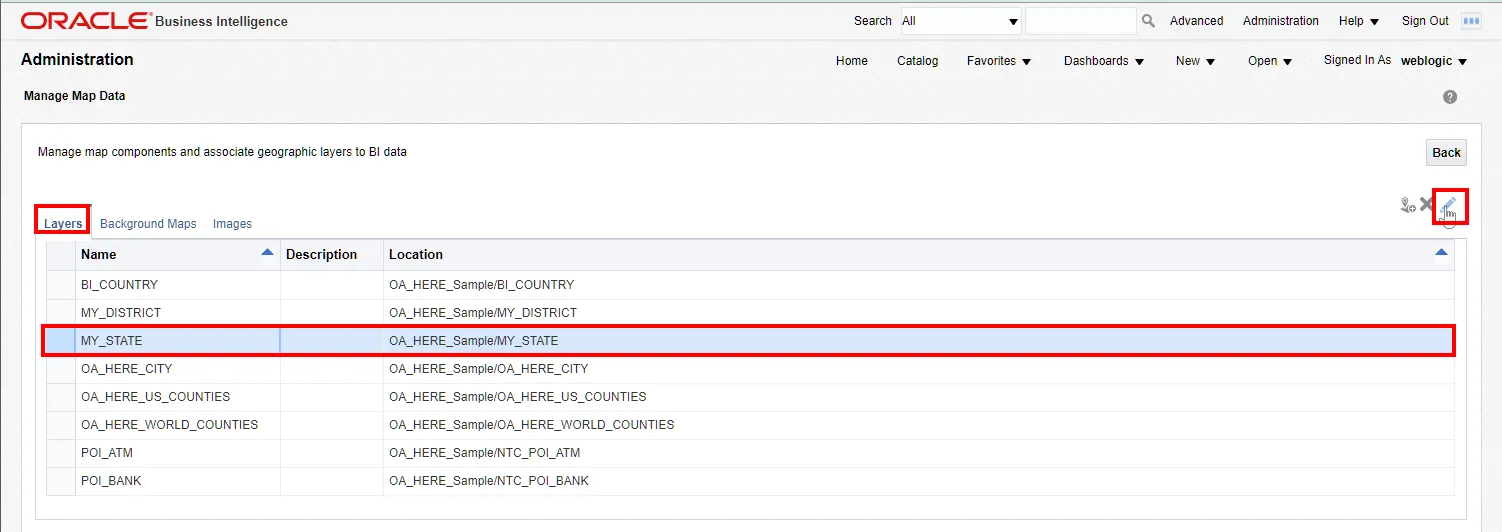
The Layers interface with MY_STATE selected, preparing to associate it with BI data. The edit button on the right allows us to configure the layer properties.
b.
Click the edit icon to open the Edit Layer dialog
c.
In the BI Associations section :
•
Set the Layer Key to "NAME_1"
•
Click the Add Column button
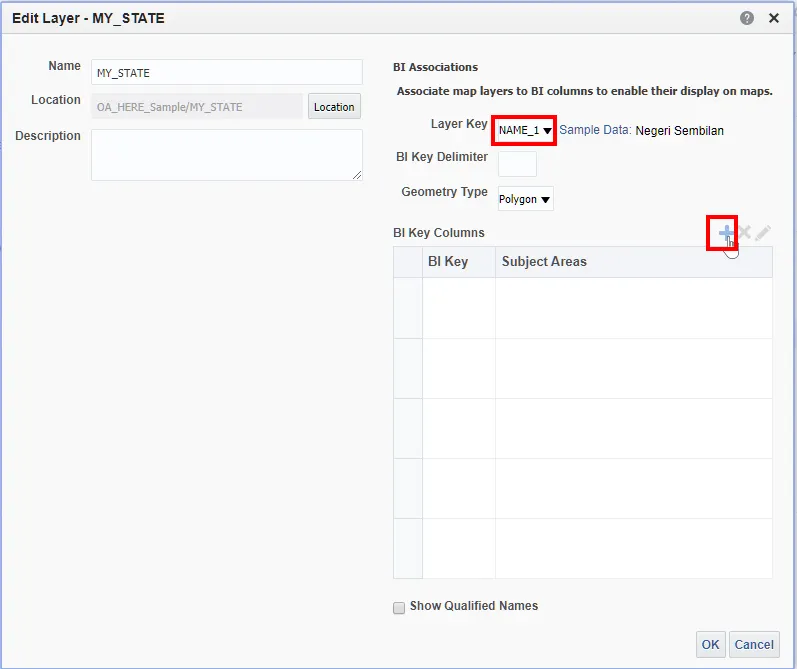
the Edit Layer dialog for MY_STATE, where we can set up BI associations. The Layer Key "NAME_1" is selected from the dropdown, and we're about to add BI Key Columns.
d.
From the Subject Area selector, choose "my_manufacturing_project_20101027"
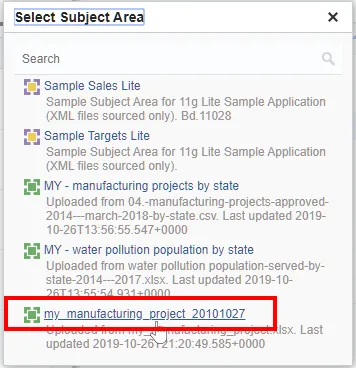
the Subject Area selection dialog, where we're choosing "my_manufacturing_project_20101027" as our data source for the layer associations.
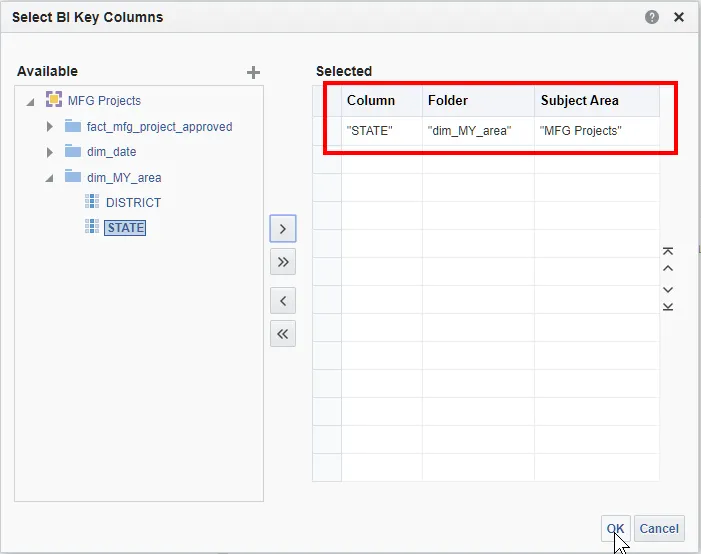
e.
Select the "state" column
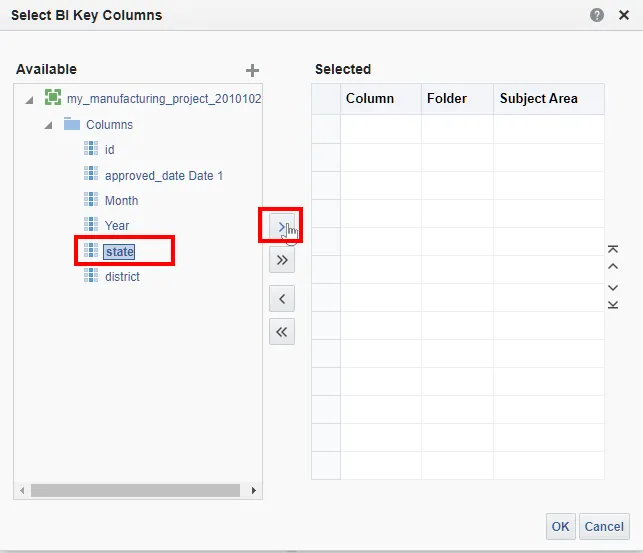
demonstrates selecting the "state" column from the available columns list to map it to our MY_STATE layer. The arrow button is highlighted to move the selected column to the right panel.
f.
Confirm the mapping is correct in the Selected panel
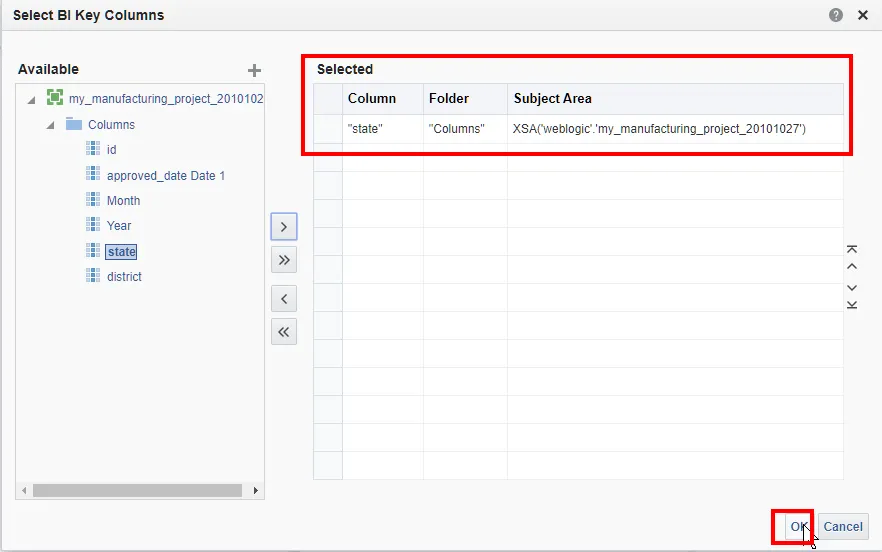
confirms the successful mapping of the "state" column to our MY_STATE layer, showing the complete column path in the Selected panel.
For MY_DISTRICT:
Following a similar process:
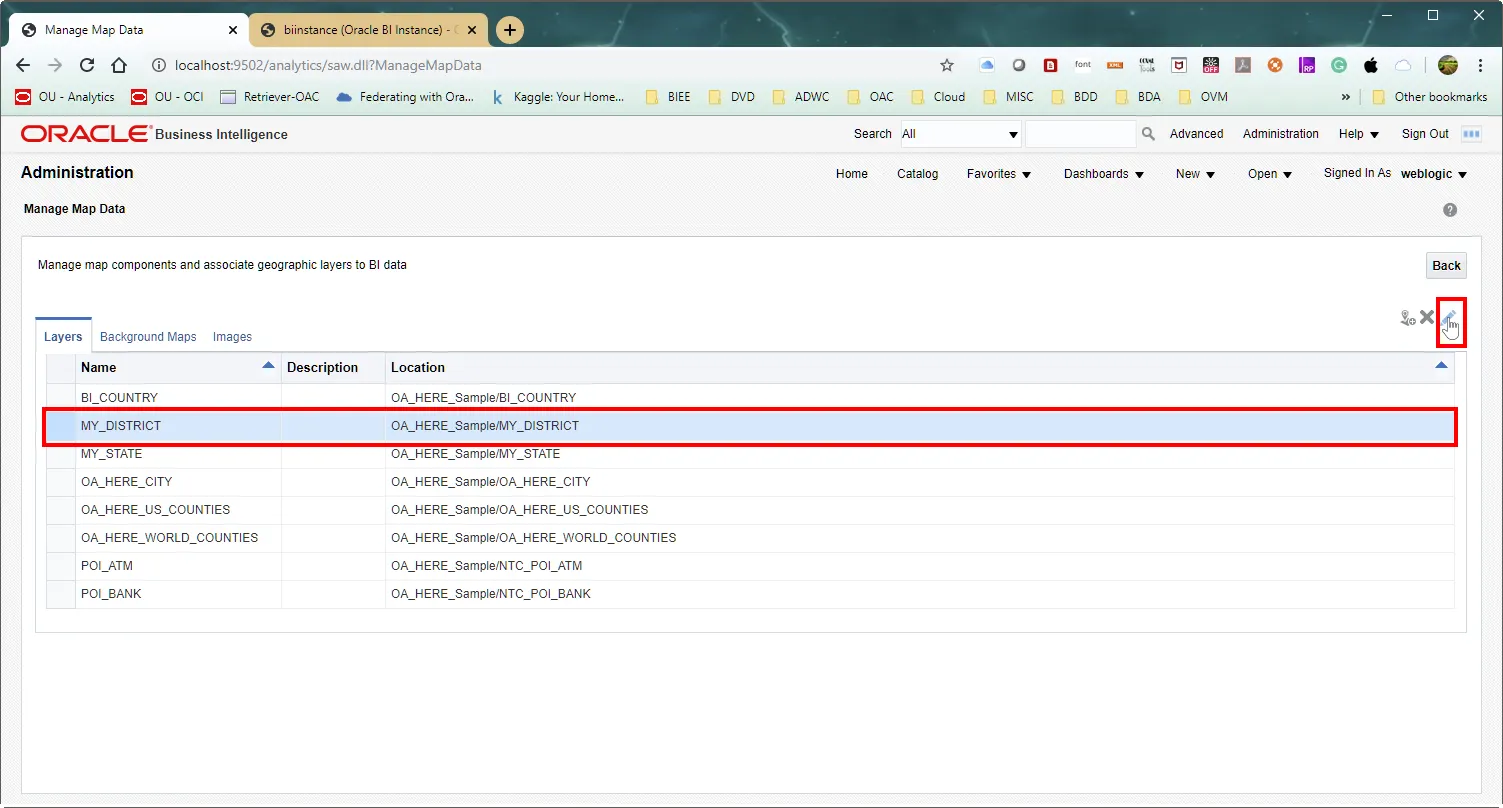
a.
Select MY_DISTRICT in the Layers list
show similar steps being repeated for the MY_DISTRICT layer, where we select the "district" column to associate it with the geographic data.
b.
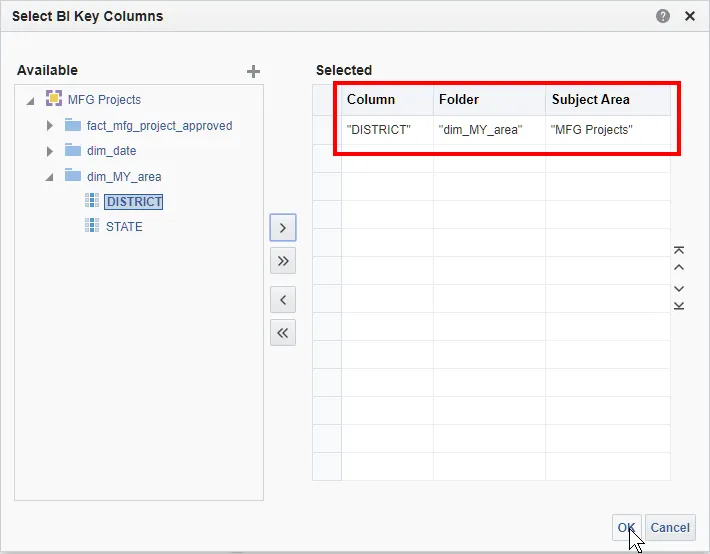
In the Edit Layer dialog:
•
Configure the appropriate Layer Key
•
Add the "district" column from the same subject area
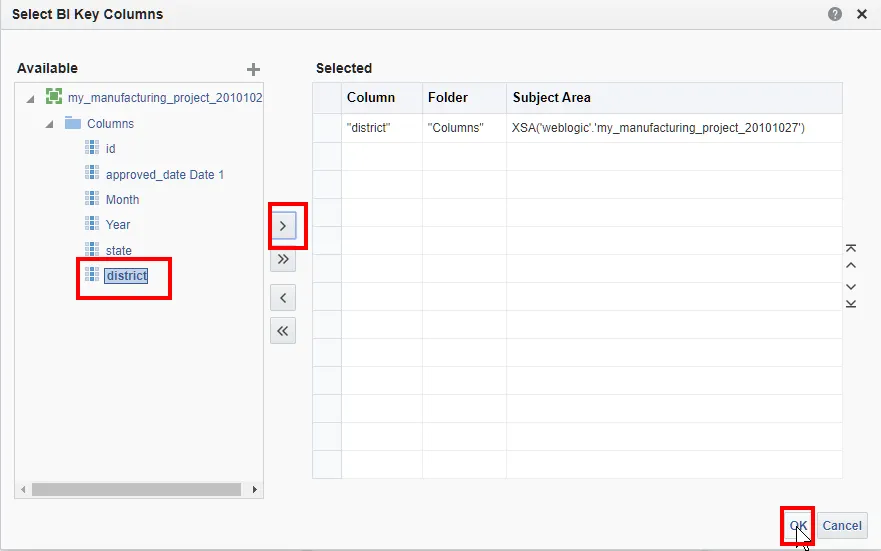
show similar steps being repeated for the MY_DISTRICT layer, where we select the "district" column to associate it with the geographic data.
c.
Verify the mapping in the Selected panel
Through these steps, we've successfully:
1.
Imported both MY_STATE and MY_DISTRICT map tile layers
2.
Associated each layer with the corresponding BI key columns from our manufacturing project subject area
3.
Verified the proper configuration of both layers in the Map Data Management interface
This configuration creates a vital link between our geographic data and business intelligence data. When properly set up, these associations allow us to:
•
Visualize data at both state and district levels
•
Create dynamic map-based analyses
•
Enable drill-down capabilities from state to district level
•
Ensure accurate geographic representation of our business data
The final result is a fully configured map layer system that seamlessly integrates geographic visualization with our business intelligence data, enabling rich spatial analysis capabilities in our BI reports and dashboards.
2.6 Managing Background Maps in OBIEE
Let's break down this process into two main parts: importing base maps and configuring their interactive layers.
1.
Importing Base Maps
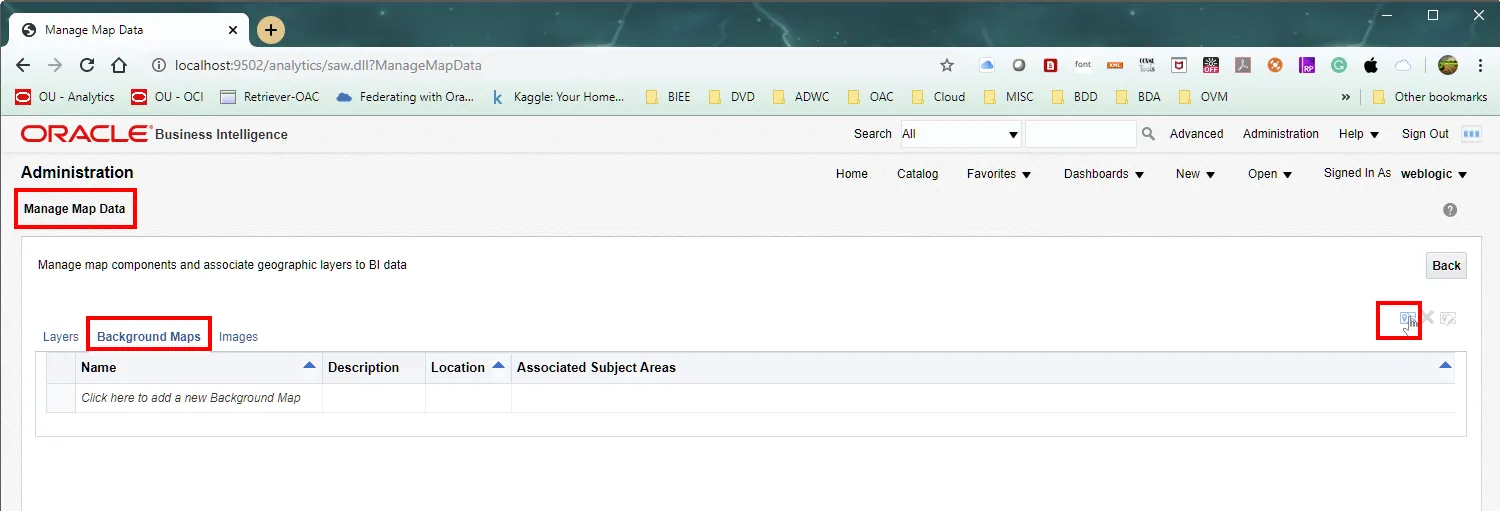
The Oracle Business Intelligence Administration interface showing the Manage Map Data section. The Background Maps tab is selected, and the import button (plus icon) is visible in the top right corner, ready for adding new background maps to the system.
Looking at the above image, we can start in the Oracle BI Administration interface, where we navigate to the "Manage Map Data" section. Here's what we see in the interface:
•
The main navigation tabs: Layers, Background Maps, and Images
•
The Background Maps tab selected, showing us available map configurations
•
An import button (plus icon) in the top right corner for adding new maps
Below image shows the Import Background Maps dialog, where we:
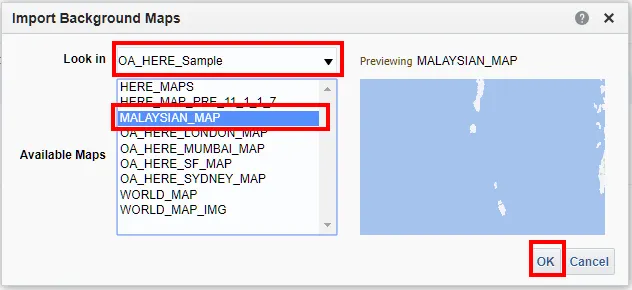
The Import Background Maps dialog window displaying the selection process for a new background map. The "OA_HERE_Sample" data source is selected in the dropdown, and "MALAYSIAN_MAP" is highlighted in the Available Maps list. A preview pane on the right shows the selected map's coverage area.
•
Set "OA_HERE_Sample" as our data source in the "Look in" dropdown
•
Select "MALAYSIAN_MAP" from the Available Maps list
•
See a preview of our selected map on the right panel
•
Confirm our selection by clicking the OK button
Below image displays the successful result of our import, with:
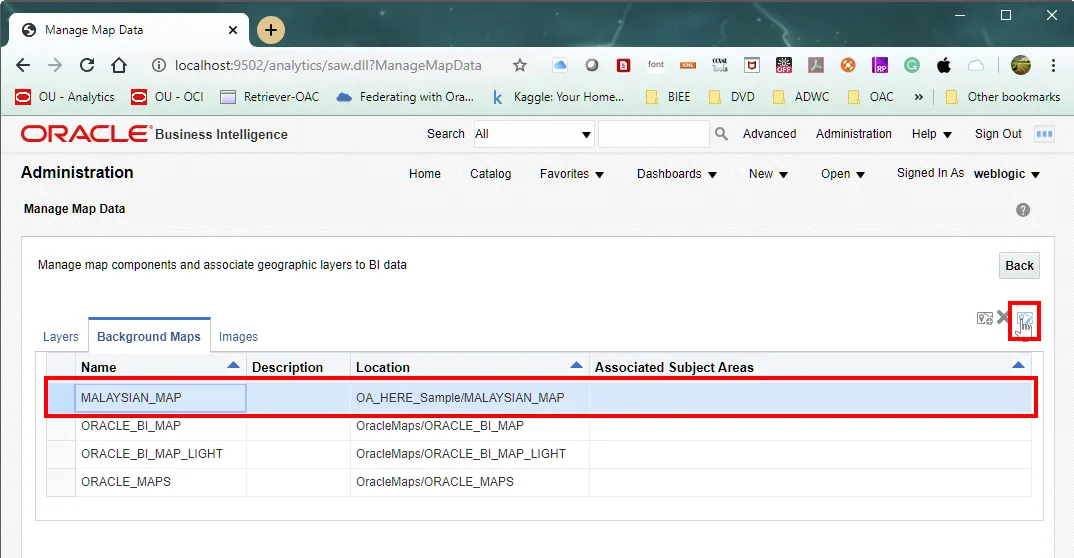
The Background Maps management interface after successful import, showing MALAYSIAN_MAP listed in the main table with its location path correctly set to "OA_HERE_Sample/MALAYSIAN_MAP". This view confirms the successful addition of our new background map to the system.
•
MALAYSIAN_MAP now listed in the Background Maps table
•
The correct location path shown as "OA_HERE_Sample/MALAYSIAN_MAP"
•
The map ready for further configuration
2.
Configuring Interactive Layers
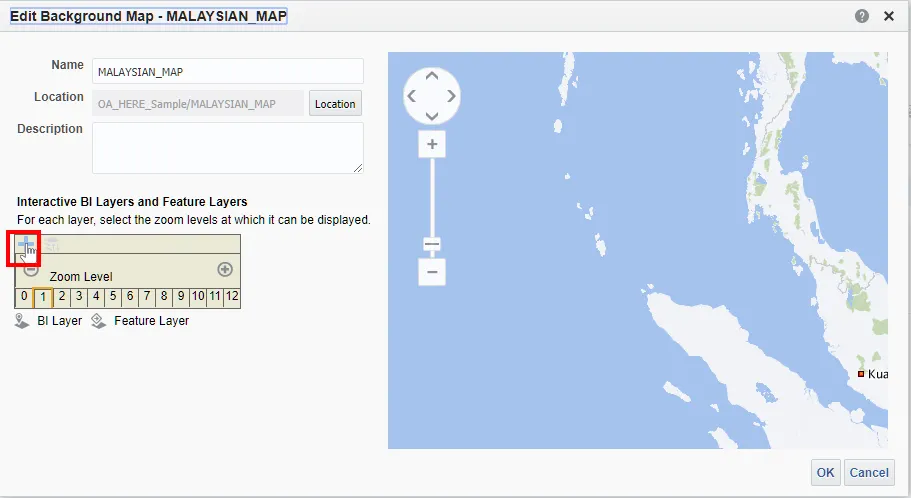
The Edit Background Map dialog for MALAYSIAN_MAP, showing the initial configuration state. The interface includes the map's basic properties, a preview panel, and the Interactive BI Layers section where we can add and configure map layers. The plus icon for adding new layers is highlighted.
Moving to the configuration phase, the above image shows the Edit Background Map dialog where we:
•
See the basic properties of our MALAYSIAN_MAP
•
Have access to the Interactive BI Layers and Feature Layers section
•
Can use the plus icon to add new layers
The image below presents the Add Layers dialog where we:
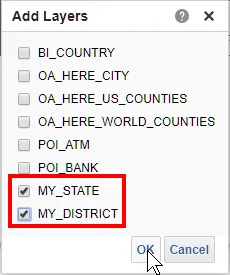
The Add Layers selection dialog showing both MY_STATE and MY_DISTRICT layers selected for addition to our background map. This compact dialog allows for efficient multiple layer selection in one operation.
•
Select both MY_STATE and MY_DISTRICT layers
•
Can choose multiple layers simultaneously
•
Confirm our selections with the OK button
In this image we can see the results of our layer configuration:
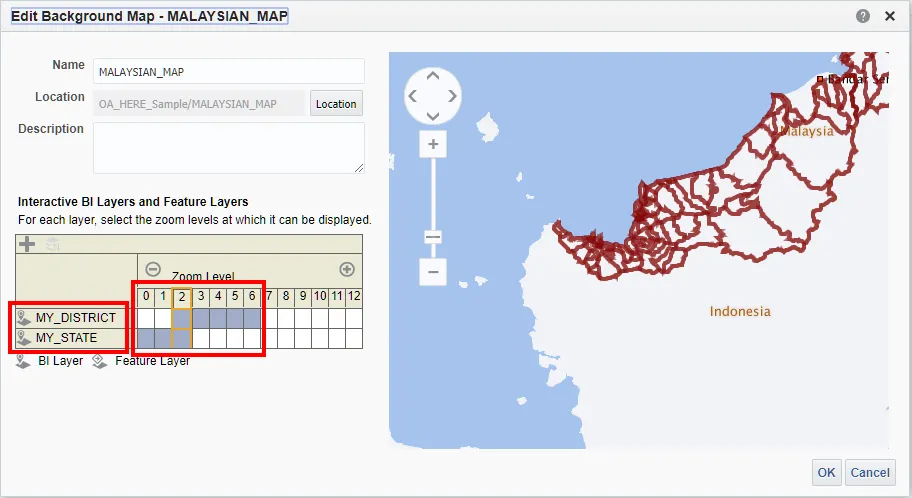
The Edit Background Map dialog after layer addition, displaying both MY_STATE and MY_DISTRICT configured in the layers panel. The preview window now shows the geographic boundaries with zoom levels 0-12 available for configuration, demonstrating the successful integration of our layers.
•
Both MY_STATE and MY_DISTRICT layers are now visible in the layers panel
•
The preview window shows the boundaries of our geographic regions
•
Zoom levels are available for configuration (0-12)
•
The map preview updates to show our selected layers
Finally, below image shows the completed configuration in the Background Maps list:
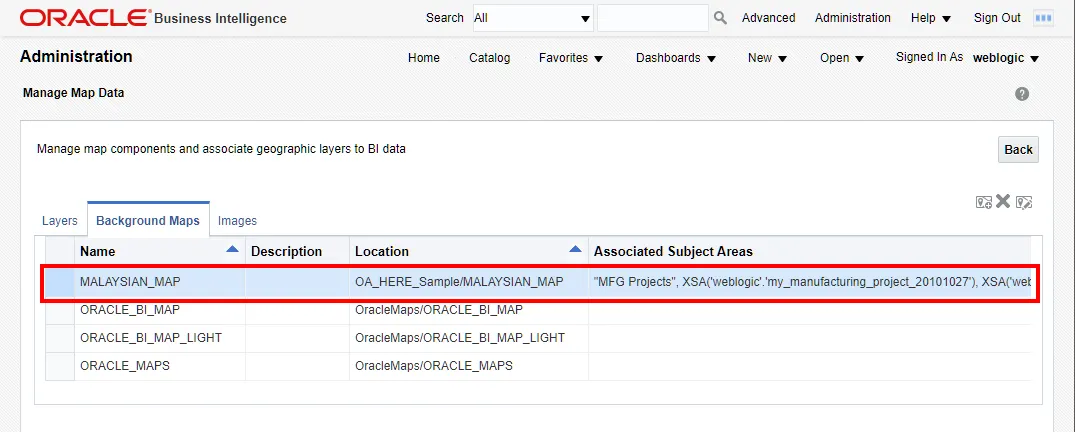
The final view of the Background Maps list, showing MALAYSIAN_MAP with its complete configuration. The Associated Subject Areas column displays the connection to the manufacturing project data, confirming the proper setup of our map layers and data associations.
•
MALAYSIAN_MAP with its associated subject areas
•
The proper connection to our manufacturing project data
•
All layers correctly configured and ready for use
This configuration enables:
•
Interactive geographic visualization at both state and district levels
•
Proper zoom level functionality for detailed exploration
•
Integration with our business intelligence data
•
Dynamic map rendering based on user interaction
The completed setup allows analysts to create rich, interactive map-based visualizations that combine geographic data with business metrics, enabling sophisticated spatial analysis in our BI reports and dashboards.
These configurations form the foundation for creating dynamic, interactive map visualizations in OBIEE, allowing users to explore data at different geographic levels while maintaining proper data associations and visual hierarchies.
Part 3: Creating Map Visualizations in OBIEE: Connecting RPD Models to Geographic Data
In Oracle Business Intelligence Enterprise Edition (OBIEE), creating effective map visualizations requires proper connection between your RPD (Repository) model and map tile layers. This post will guide you through the process of setting up and troubleshooting these connections to create powerful geographic visualizations.
3.1 Understanding the Prerequisites
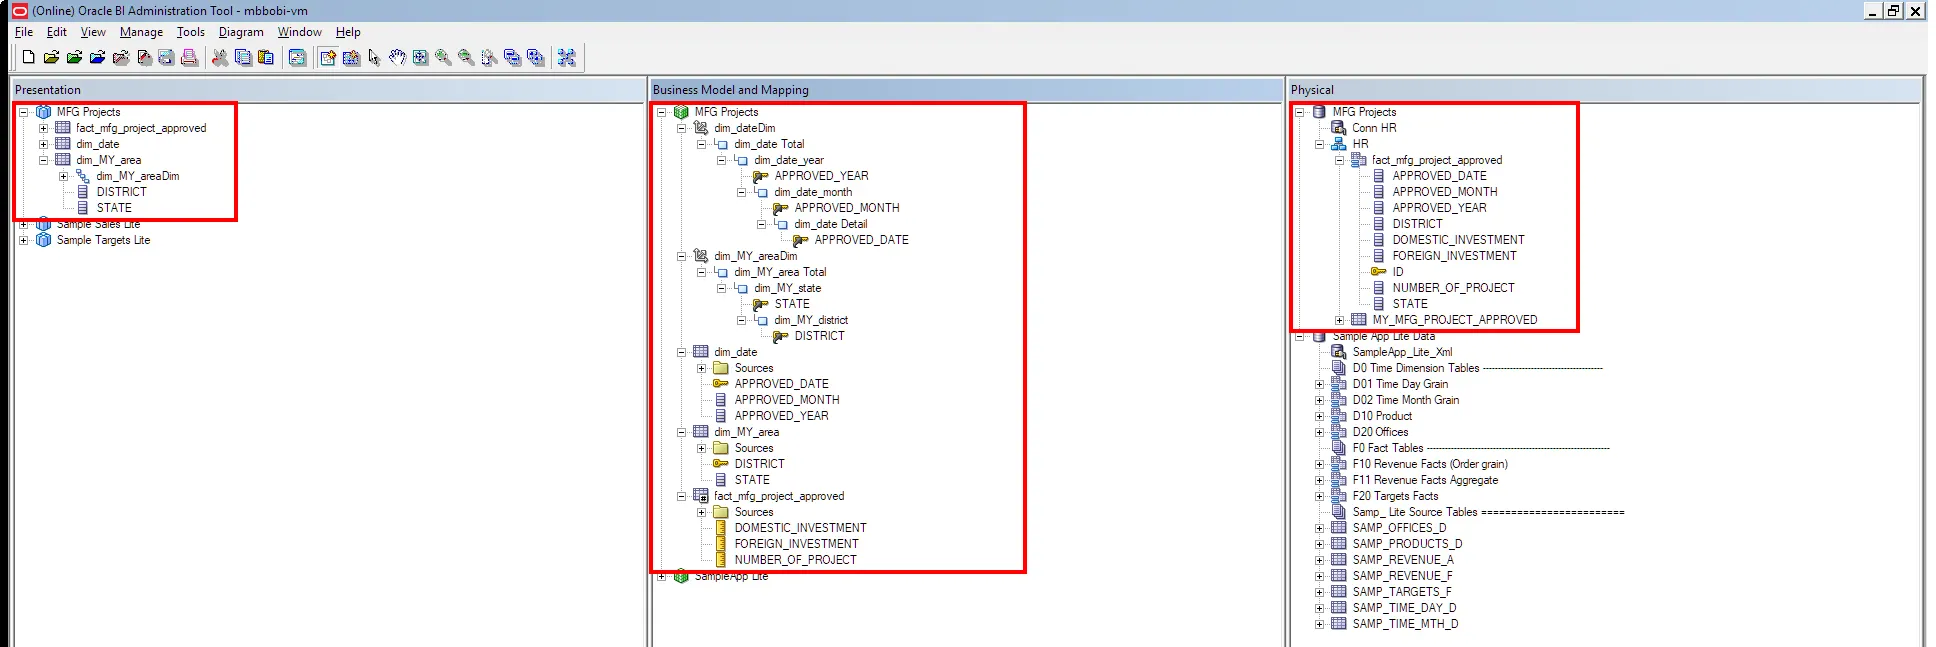
Before diving into map creation, let's examine our data structure. Below image shows an example visualization attempt.
and this image reveals our RPD model structure containing:
•
Presentation Layer: MFG Projects with DISTRICT and STATE hierarchies
•
Business Model Layer: Dimensional model with fact_mfg_project_approved
•
Physical Layer: Database tables with geographic and business data
3.2 The Importance of Layer Mapping
When attempting to create a map visualization without proper layer mapping, you'll encounter an error message like the one shown in the below image:
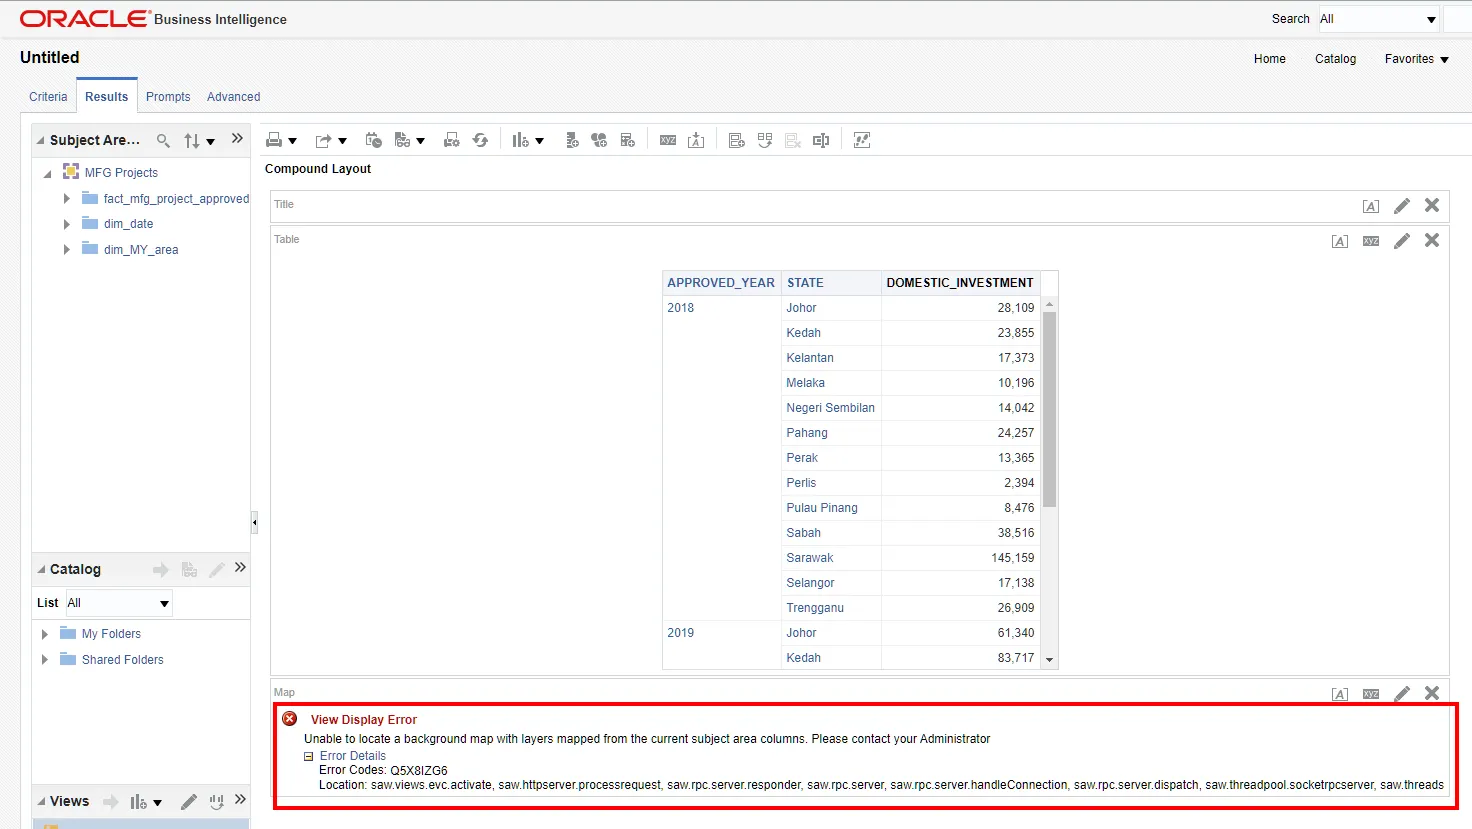
Unable to locate a background map with layers mapped from the current subject area columns. Please contact your Administrator
Plain Text
복사
This error indicates that while we have geographic data in our RPD, it hasn't been properly connected to the map tile layers in OBIEE.
3.3 Setting Up Map Layer Connections
Let's establish the connections for both state and district levels:
1.
For MY_STATE Layer:
a.
Navigate to the Manage Map Data interface
b.
Select the MY_STATE layer
c.
In the BI Key Columns selection:
•
Choose "STATE" from dim_MY_area
•
Map it to the "MFG Projects" subject area
•
The mapping should show: Column="STATE", Folder="dim_MY_area", Subject Area="MFG Projects"
2.
For MY_DISTRICT Layer:
a.
Similarly, select the MY_DISTRICT layer
b.
Configure the BI Key Column mapping :
•
Select "DISTRICT" from dim_MY_area
•
Connect it to the same subject area
•
Verify the mapping shows: Column="DISTRICT", Folder="dim_MY_area", Subject Area="MFG Projects"
3.4 Testing the Map Visualization
After establishing these connections, we can create our visualization:
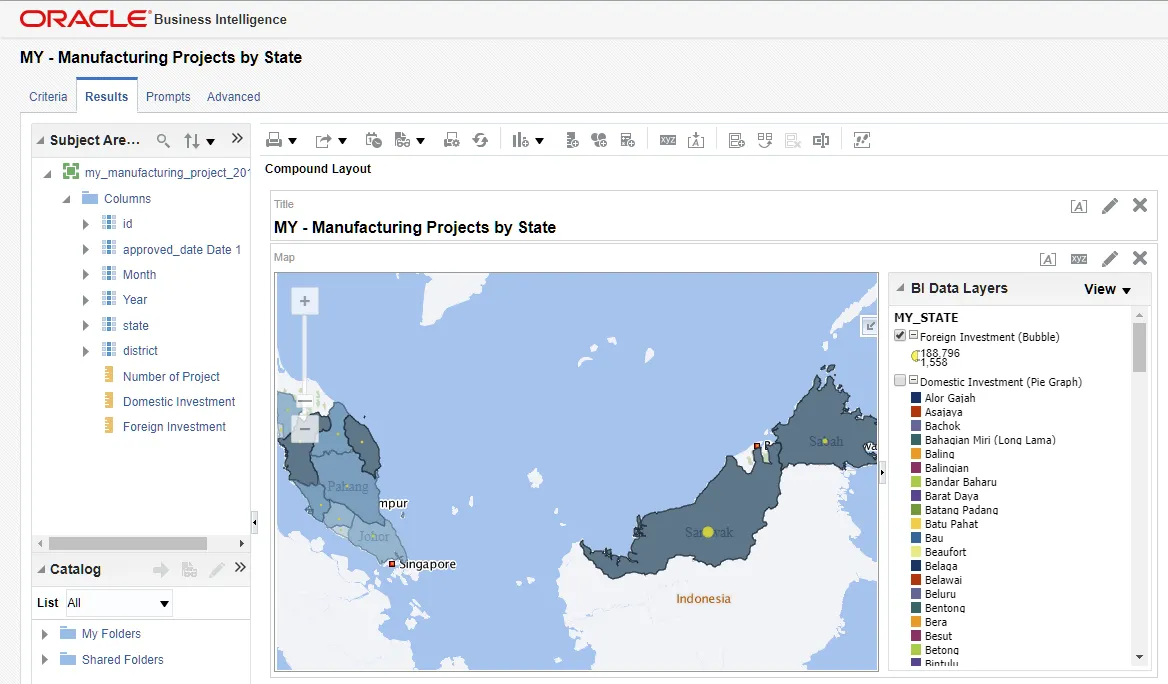
1.
This image shows a successful state-level visualization:
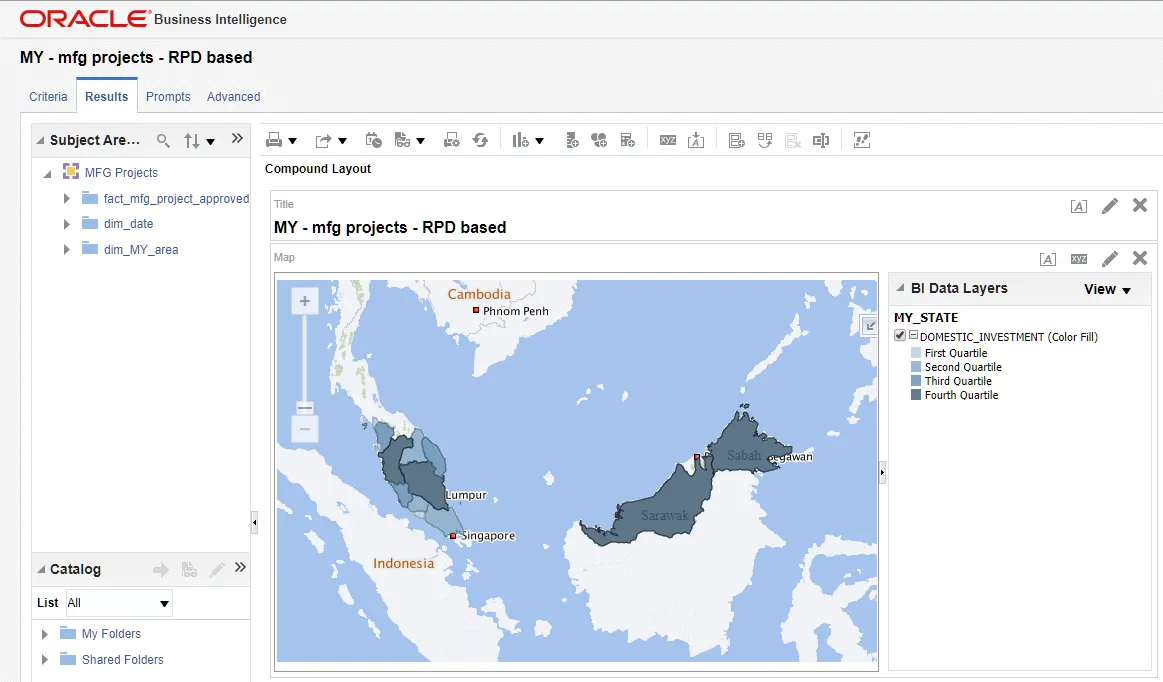
•
The map displays Malaysia's states with color gradients
•
BI Data Layers panel shows DOMESTIC_INVESTMENT as a Color Fill option
•
Different quartiles are represented by varying shades
2.
It demonstrates the interactive capabilities:
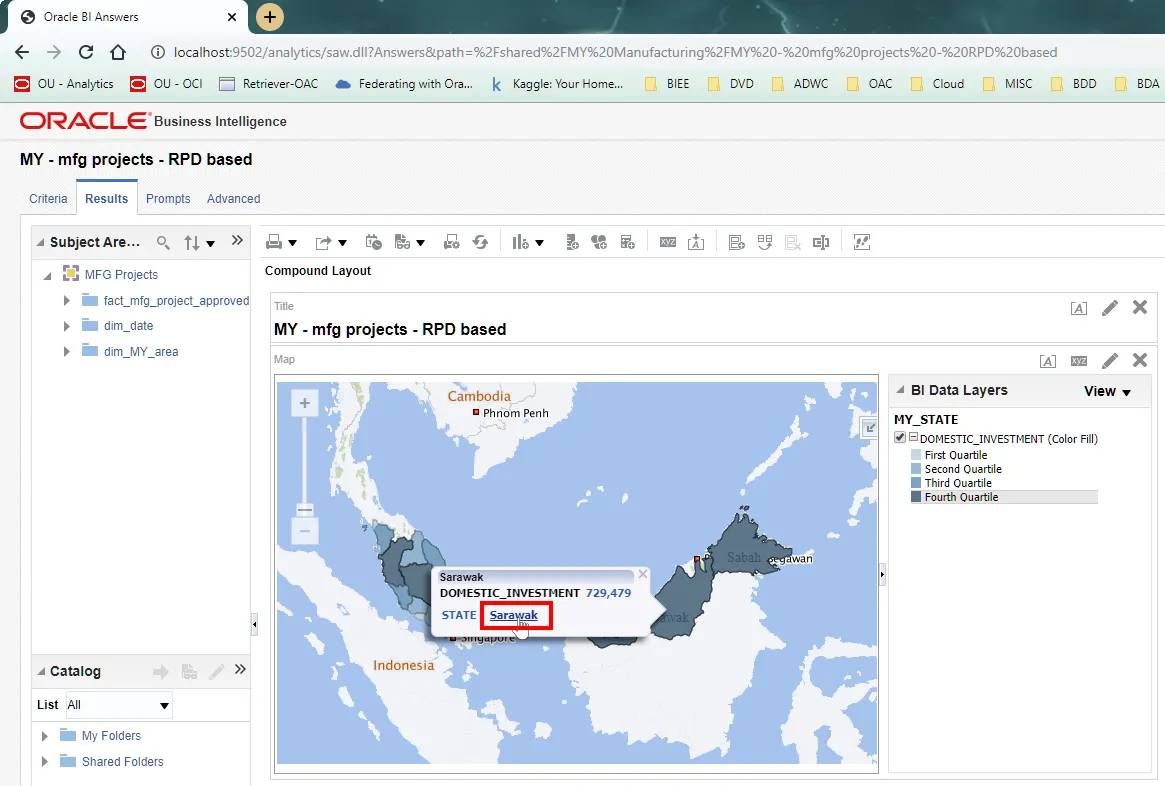
•
Hovering over Sarawak shows detailed statistics
•
The tooltip displays both state name and DOMESTIC_INVESTMENT value
•
Clear visual differentiation between regions
3.
Below showcases the district-level detail:
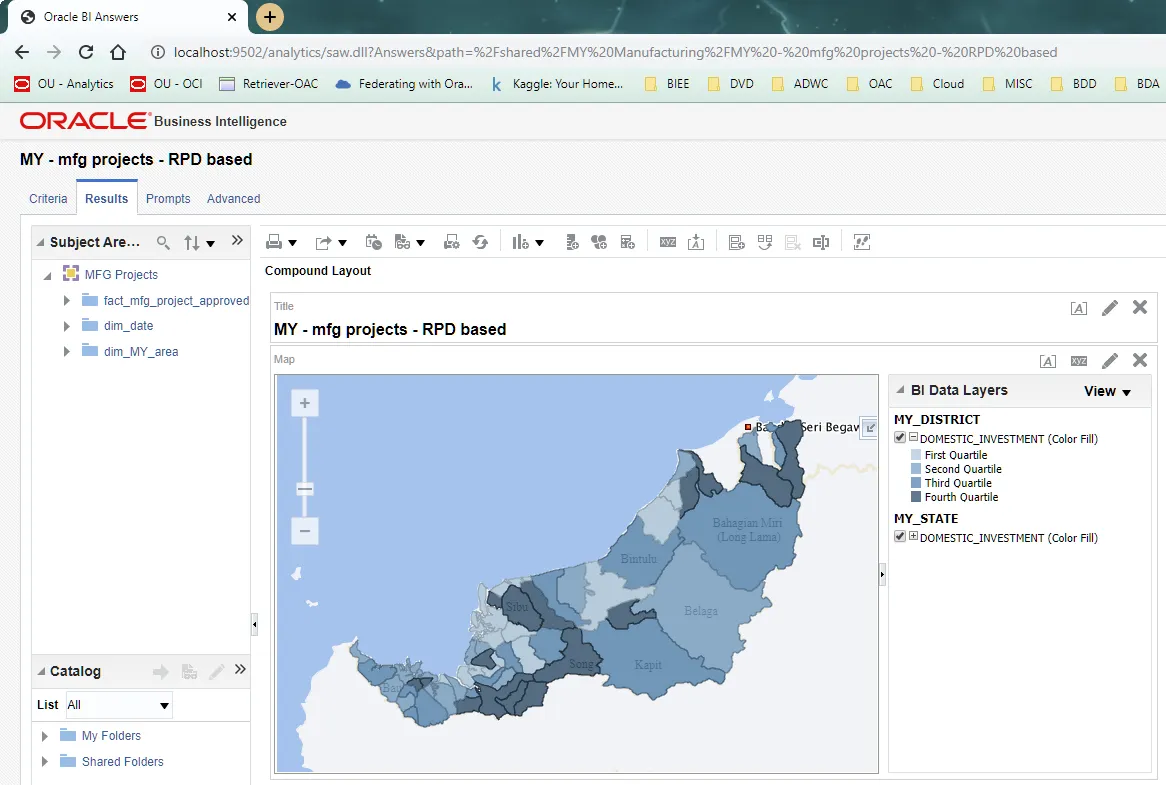
•
Successfully drilled down to show district boundaries
•
Maintained consistent color coding for investment levels
•
Both MY_STATE and MY_DISTRICT layers visible in the BI Data Layers panel
Key Takeaways
1.
RPD modeling alone isn't sufficient for map visualizations - proper layer mapping is essential
2.
Each geographic level (state, district) needs its own mapping configuration
3.
The mapping creates a bridge between your business data and geographic visualization
4.
Always verify both the technical connection and visual representation
5.
Interactive features become available only after proper mapping
Troubleshooting Tips
If you encounter mapping issues:
•
Verify the column names match exactly between RPD and map layers
•
Check that the subject area is properly associated
•
Ensure the geographic hierarchy in your RPD matches the map layer structure
•
Test with simple visualizations before adding complex metrics
By following these steps and understanding the connections between RPD modeling and map tile layers, you can create rich, interactive geographic visualizations in OBIEE that effectively communicate your spatial data insights.
[End of post]
#OBIEE #MapVisualization #DataAnalytics #BusinessIntelligence #MalaysiaMap